[CRYPTO TRADING STRATEGY WITH MEDIAN INDICATOR]- Steemit Crypto Academy- Homework post for Professor @abdu.navi03 by @preshymukel
Hello great Steemians, I welcome y’all to my homework post for professor @abdu.navi03 on “CRYPTO TRADING STRATEGY WITH MEDIAN INDICATOR” in the 4th week of season 6 of the Steemit Crypto Academy.

1-Explain your understanding with the median indicator.
The Median indicator is a technical tool used in analyzing the finance market. Indicators are essential tools in technical analysis as it help traders make good trade decisions.
The Median indicator is a trend-based indicator that is used to determine the trend of an asset in the market, it helps tell the direction of the price movement by providing a single-line chart that shows the day's “average price”.
The Median indicator is used to determine volatility and to measure the market direction. It forms a channel which is used to determine how the Average true range (ATR) value deviates from the median range for a specific period of length.
The Median indicator shows the median value of the average between low and high for a particular period of time, the median is then compared to the EMA of the same period of time, the distance between the median and the EMA is characterized as cloud. The color of the cloud is then used to determine the trend of the market, and the cloud basically appears in two colors; green and purple color. An uptrend is indicated by a green cloud and a downtrend is indicated when the color of the cloud is purple.
Being able to understand market trend is very necessary as it guide traders make good trading decisions and also help them to be successful, this makes the Median indicator a great indicator as it is used to know the trend of the market.
2-Parameters and Calculations of Median indicator. (Screenshot required)
Parameters of the Median indicator
The parameters used for Median indicator can be identified by visiting any platform that displays price chart. Here I'll be using the Tradingview platform to demonstrate the Median indicator parameters.
On the tradingview platform, access the chart section of it, click on indicator to add the Median indicator to the chart.
When the indicator is added, double tap on the indicator displayed on the chart to access the indicator parameters and configure them.
Tradingview
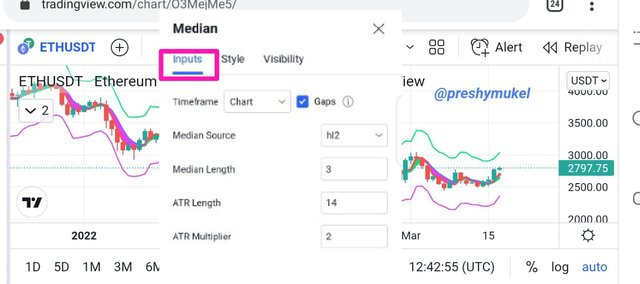
From the chart above, we can see the input parameters of the indicator which includes the following;
Median Source: It is the source on which the median calculation is based on.
Median Length: This is the length of the median, i.e. the number of data points of the Source used in calculating the median. The default number is usually 3.
ATR Length: It is the period of time to be used when calculating the Average True Range (ATR) of the median. The default number is 14.
ATR Multiplier: It is the value which is used to multiply the ATR before the bands is formed. The default number is 2.
These parameters above can be configured at anytime based in the user's choice.
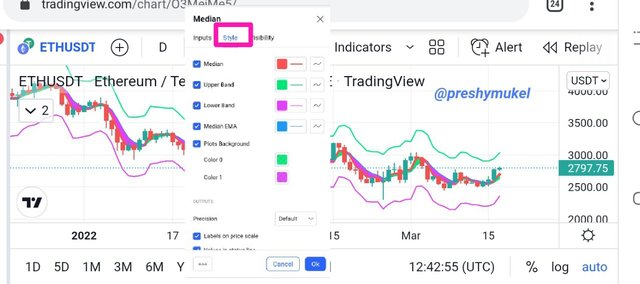
The chart below shows the style settings of the indicator, here we can configure the indicator appearance to the colors of our choice.
Tradingview
Calculation of Median Indicator
The Median indicator is calculated by using the ATR value to get the lower and upper band, the ATR value of a particular ATR length is then multiplied by a ATR multiplier which is then subtracted from or added to the median.
The calculation is mathematically shown below;
Median length = The total observed period
Median value = highest price + lowest price ÷ 2
Upper-band = Median length + (2ATR)
Lower-band = Median length - (2ATR)
3-Uptrend from Median indicator (screenshot required)
Uptrend
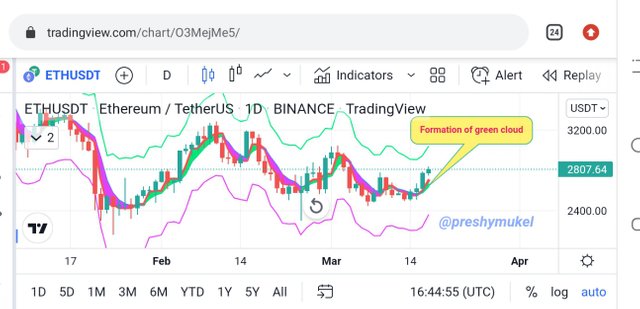
The median indicator is used to identify trends as it is a trend-based indicator. The median indicator forms a cloud which is used in identifying of trends in the market. An uptrend is indicated by a green cloud.
Example of an illustration of an uptrend using median indicator is shown below;
Tradingview
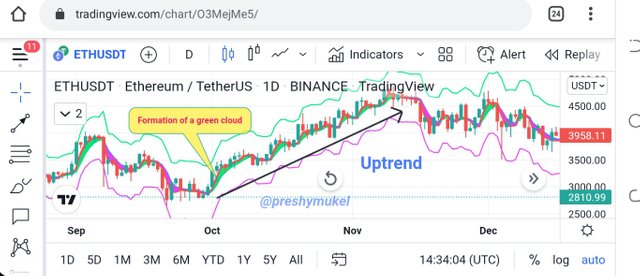
Observing the above chart, we can see how a green cloud was formed after a purple cloud showing a trend reversal from downtrend to an uptrend. On noticing the formation of a green cloud traders can place their buy orders and get it executed before a purple cloud appears.
4-Downtrend from Median Indicator (screenshot required)
In a downtrend the median indicator forms a purple cloud in a chart, and the formation of this purple cloud indicates a downtrend (bearish trend). In this case traders are ought to place their sell orders to be executed before the appearance of a green cloud.
Example of an illustration of a downtrend using median indicator is shown below;
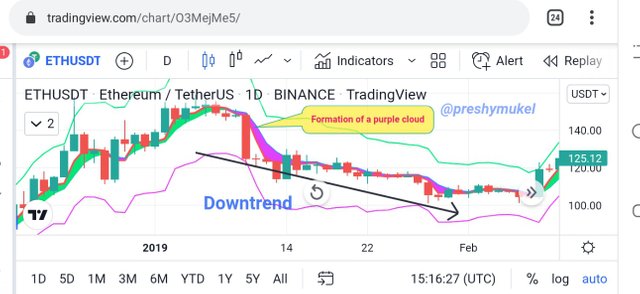
Tradingview
Observing the above chart, we can see how a purple cloud was formed after a green cloud showing a trend reversal from an uptrend to a downtrend.
5-Identifying fake Signals with Median indicator(screenshot required)
In analysing of market trends, it is advisable to combine multiple indicators as no indicator is 100 percent correct. Combining of multiple indicator help filter out fake signals and help build the traders confident.
The Median indicator as a trend-based indicator some times gives false signals too and as such it is best to combine it with other suitable indicators. In answering this question I'll be combining the Median indicator with the RSI indicator.
The RSI indicator is also a technical tool, it is a volatility-based indicator used to determine the condition of the market (oversold and overbought) at any point in time.
If the RSI crosses above 70 level, it indicates an overbought of the asset therefore signalling a bearish trend. Whereas if the RSI line crosses below the 30 RSI level, it indicates an oversold therefore signalling a bullish trend.
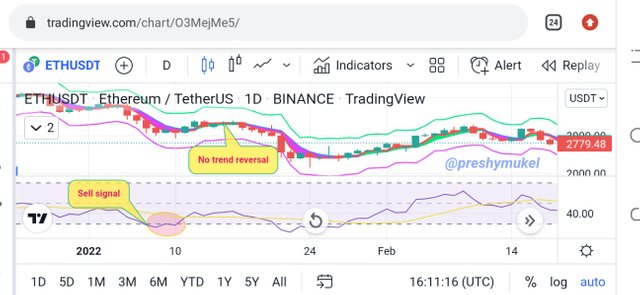
Tradingview
Observing the chart above, we can observe that the RSI line is below the 30 RSI level indicating a bullish trend, and looking at the Median indicator it is in an uptrend (purple cloud color). The Median indicator signal is therefore a false signal because it is not in agreement with the RSI indicator signal.
Therefore before making any trading decision, it is important to wait for both indicators to be in agreement.
6-Open two demo trades, long and short, with the help of a median indicator or combination that includes a median indicator (screenshot required)
Trade 1 - Buy Trade ETH/USDT
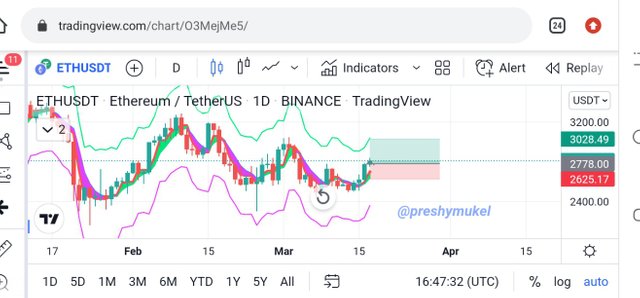
Here I'll be trading ETH/USDT using Tradingview paper trading. Before placing the buy order trade, I'll first of all analyze the market on the Tradingview platform.
Tradingview
Observing the ETH/USD chart above, I noticed a price reversal from a bearish trend to a bullish trend. Looking at the chart we can see the formation of the green cloud which indicates a bullish trend and therefore signalling a buy position. I immediately place my buy entry trade at the market price of 2778.00 setting my Stop loss to be 2625.17 and my Take Profit as 3028.49.
Tradingview
I checked back after sometime and noticed that my buy trade has hit profit. Below is the history of m buy trade.
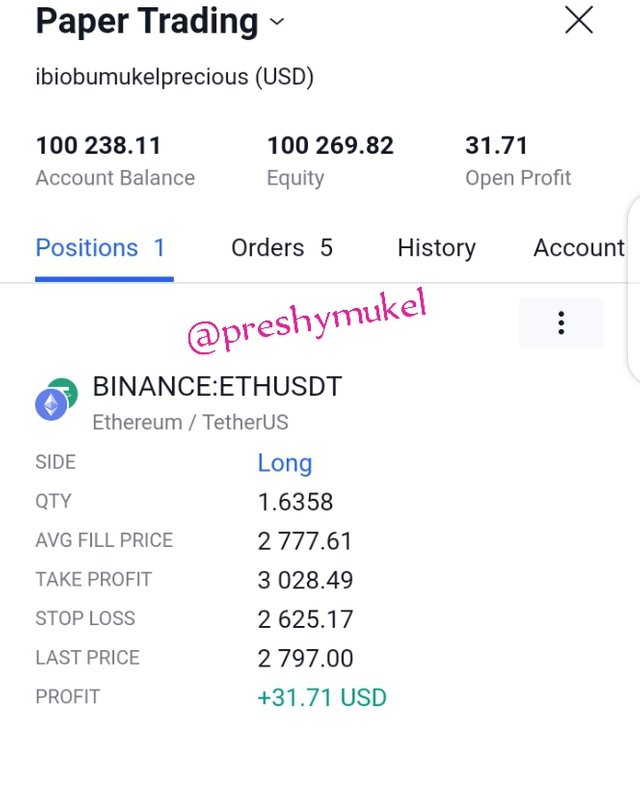
ETH/USDT trading history Tradingview
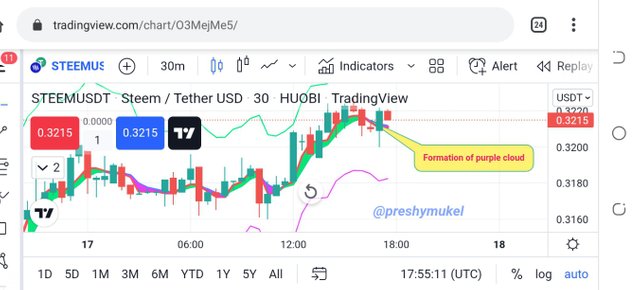
Trade 2: Sell Trade STEEM/USDT
Tradingview
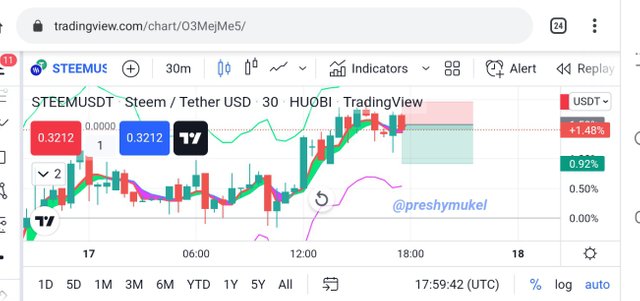
Observing the STEEM/USDT chart, I noticed a price reversal from a bullish trend to a bearish trend. Looking at the chart we can see the formation of the purple cloud which indicates a bearish trend and therefore signalling a sell position. I immediately place my sell entry trade at the market price of 0.3215 setting my Stop loss to be and my Take Profit as 0.3194.
Tradingview
I checked back after sometime and noticed that my sell trade has hit profit. Below is the history of m sell trade.

STEEM/USDT Sell history Tradingview
Conclusion
Indicators are essential tools in technical analysis as they help tell the direction of the market trend at any given time.
The median price indicator is used to display the average prices (high and low) of a particular length period. Thereby helping traders to determine the direction of the market trend as well as the volatility.
The Median indicator is no doubt a great indicator, but it is best to combine it with other suitable indicator to get accurate signals.
Thank you professor @abdu.navi03 for this educative lesson.