Trading strategy with median indicator// Steemit Crypto Academy//S6W4// Assignment posting for teacher @abdu.navi03

Source

1-Explain your understanding with the median indicator?
The median indicator is used to define trends, in this way we know when there is a certain level of volatility in the market through its two clouds has two one green and one purple, these data are very important to perform a technical analysis gets on the asset, the median indicator has a strong objectivity by trends through its moving lines, heikin, ashi clouds etc. that using the ATR and a multiplier can define us trends very easily according to the crossovers in the corresponding temporality.
The indicator consists of a moving line MA a moving line EMA uses a purple cloud and a green cloud the crossing of these lines together with the clouds and the color of these define us the market trend according to the temporality of it. when the lines cross for example the EMA passes below the MA is defined as an uptrend when the EMA passes above the MA then it is a downtrend.
The average indicator is a very strong tool that we can use to define trends verify volatility identify entry and exit points to trade the market, you can supplement the information with other indicators that allow us to identify the true signals of the false.
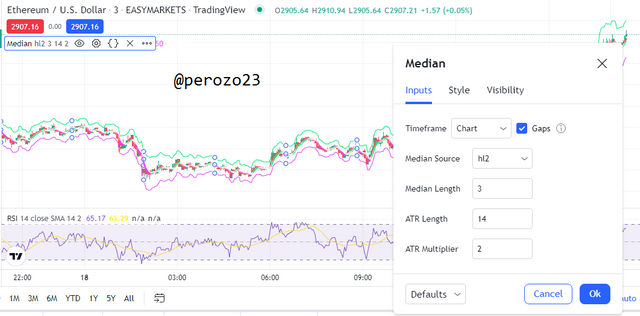
2-Parameters and Calculations of the Median indicator. (Screenshot required)
It is normally used with the "Default" setting in short timeframes using scalping strategies, from this bike to be able to define the calculations correctly, the parameters required for the calculation of the median indicator is the ATR and the chart multiplier also we will owe the bands according to its length both the lower and upper.
For the median calculation we can say that it is the number of points given to be able to calculate the average with a default estimated value of 3
for the ATR in periods obtained from an ATR mean with a default range of 14.
For ATR multiplier is multiplied by the ATR of the upper and lower band range by default 2.
U.B= M.L +(2ATR)
L.B= B.L - (2ART)
Source
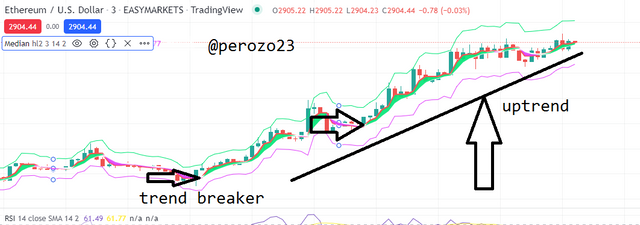
3-Uptrend from the median indicator (screenshot required)
In the uptrend from the median indicator we can see in the following chart of ETH/USDT 3m how.
an ascending green cloud is formed we also look at how the median Ema was placed below the median Ma this is a bullish signal.
As we see in the following chart we see that it starts a bullish signal where you can put a long then we see a clear correction signal which is normal in these trends to continue its upward path later with a clear upward signal.
Source
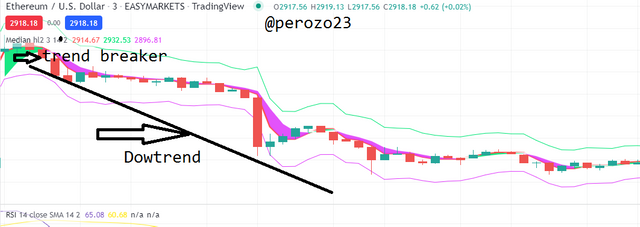
4- Downtrend median indicator 4 (screenshot required)
In the downtrend in the following ETH/USDT 3m chart gives us a purple cloud, where the MA moving average passes below the EMA median this happens when there is a bearish trend or bearish signal on the chart. i.e. the signal moves above the price this gives us an entry signal to trade the market short.
If we look at the chart we can see how a cross is created with the moving averages EMA and MA creating a downtrend after a previous uptrend, then it is important to first define which strategy to use to trade this market as I said before it is recommended to use in short periods.
Source
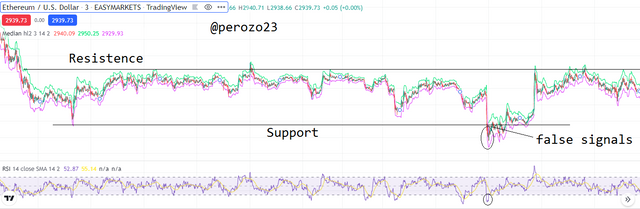
5-Identifying false signals with median indicator (screenshot required)
Only with the median indicator alone can not determine a false signal therefore we must combine the median indicator with an indicator that allows us the confirmation of the false signals. we will use the RSI by this indicator we can identify the overbought and oversold bands by these bands we can say that if it touches the band above the parameter of 70 then it means that we are in overbought position and if we see it below the parameter of 30 then we can say that this in oversold with this information plus the information of the median indicator we can determine the false signals.
Source
This is a false breakout signal, since the movement is seen as the purple band appears the averages are crossed but if we look at the RSI we see an erratic movement for the change of trends as this is positioned below the parameter of 30 returns to touch the parameter again to fall into a semi range and back to touch the previous highs that made in that temporality. giving as a false movement in this case many investors lose assets thanks to movements like these therefore we must be careful with this kind of erratic movements using other indicators combined.
6-Open two demo trades, long and short, with the help of a medium indicator or a combination including a medium indicator (screenshot required)
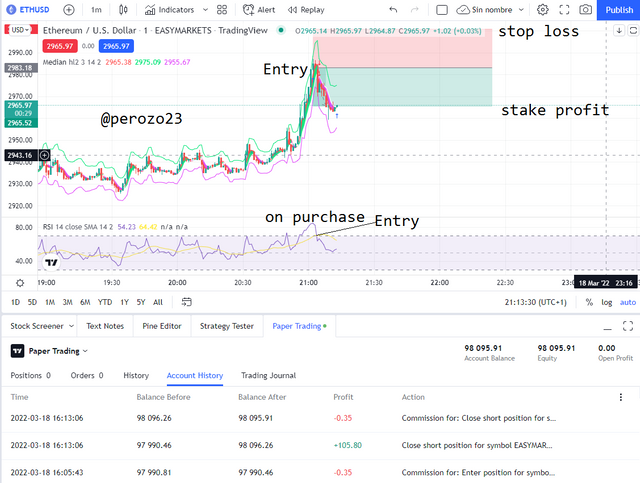
Short demo trade:
In the following trade we can see a clear bullish overbought signal and a good entry point to go short. therefore I open a short trade which indeed happens cleanly and comes out successful.
We can see that the invested amount is 10 ETH and we earn in a short time +105.80$ using the scalping method quickly we are looking at the chart in neutral positions on the RSI and we wait for the next my wind to make the next trade The RSI tells me that the correction came to an end at that exit point, which we take profits we exit the trade and wait for the next move which in this case could be bullish after the correction to the mean.
Let's see how the purple color is visible with the Ema line and the average MA line above the current price which indicates a clear downtrend in this case correction until it stops at a point of $ 2965.97 which means the rejection of that fall by investors and then a purchase or entry in range possibly.
Source
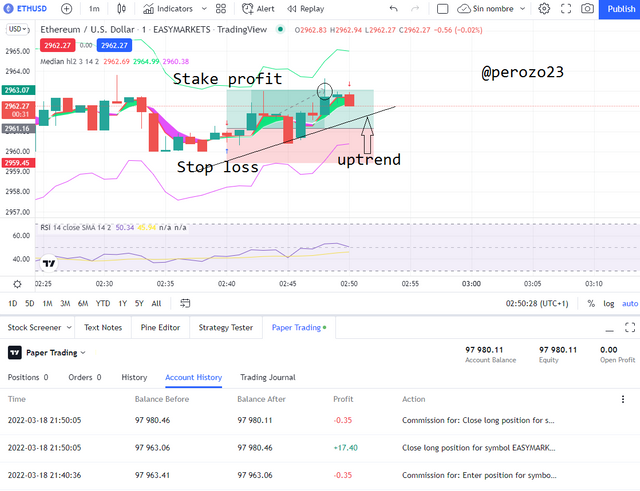
Long demo operation:
As we can see the median MA and EMA cross below the current price creating a green cloud that indicates us at that moment an uptrend in the next temporality taking advantage that is in a range and is respecting the moving average we see a clear rebound where we start to operate the order giving as a positive result of +17.40$ in a few seconds using the scalping strategy, we set our top loss and stake profit and let the operation run.
Source
Conclusion:
In this assignment I have discussed everything about the median indicator my own analysis theory and exercises that will help you with the best possible understanding according to the objective of this we will also have a small guide on how to use the indicator what are its parameters and how it is calculated, that is to say that with this median indicator we can identify entry and exit trends to improve our trading style.
When we talk about the median indicator we can say that it is a tool which encompasses several indicators together in one but these are not enough sorteros to be used only we must complement with another indicator such as RSI, as we saw in the previous example thank you all for your great attention see you in a next task.
Cc:
@abdu.navi03