Crypto Academy / Season 3 / Week 8 - Homework Post for Professor @cryptokraze. Trading Sharkfin Pattern by @perozo23
Source

Great greetings to the teacher @cryptokraze and all the integrates of this community where we grow every day more in our way to be professionals I have learned great knowledge since the first season of the academy until now and I see that every week is something new to learn is that there are so many things that feed us with knowledge is great today I will talk about the shark fin pattern a very important pattern and very good to operate within some market. I will answer each of the questions with my own words and understanding I hope you enjoy it.

1 What is your understanding of shark fin patterns? Give examples (clear charts are needed)
The shark fin pattern can be visualized on the chart in bullish or bearish directions depending on the volatility or the direction of the trends in this way it creates a V-shaped pattern hence its name shark fin therefore it is very clear to see it on cryptocurrency charts and other digital assets if we look at some chart we can see the big movements of users or companies called whales moving their capital either to take profit or to protect their assets from sharp changes in trading.
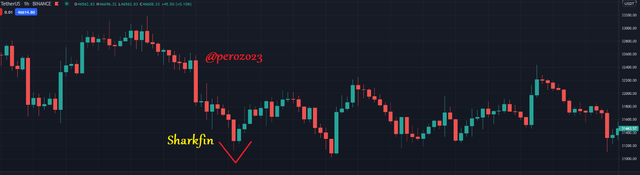
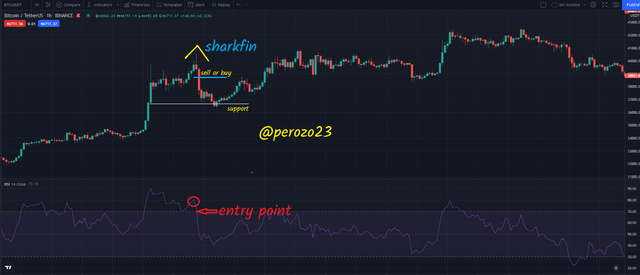
Example shark fin bullish shape:
It is formed just when there is an oversold movement and many investors see it in the RSI after it drops below 30 and then touches again the 30 at that point is the ideal time to enter when the shark fin pattern is formed because the price usually corrects quickly and more if whales at that point buy to take profits higher thus remembering to exit at strategic points to manage well the risk to loss just in case it turns us due to the high volatility that have crypto markets.
Source
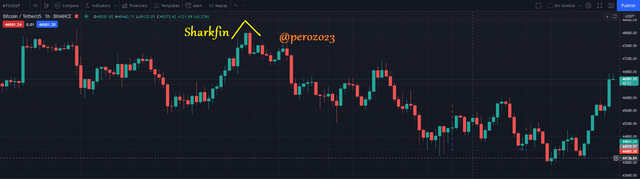
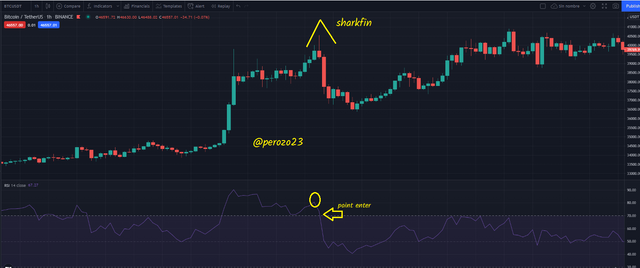
Example shark fin bearish way:
Occurs when the shark fin goes in reverse ie bearish form ie when there is a large overbought movement and then the whales take profits and is as in the following example:
The following chart of BTC/USDT in 1hour time frame as a shark fin is formed in reverse this can indicate us signal of fall so you have to make decisions quickly. these movements are usually fast and strong in this way having a solid strategy we can generate money or protect it from volatility by changing to stable currency and then buy lower. or just go with a short to generate capital.
Source
2 Implement the RSI indicator to detect shark fin patterns. (Clear charts are needed)
Implementing the RSI which allows you to see when there is overbought or oversold when the point points out that is above 70 is that there is at that time an overbought and when it is below 30 there is an oversold. then let's see the graph with the example of an oversold and its explanation.
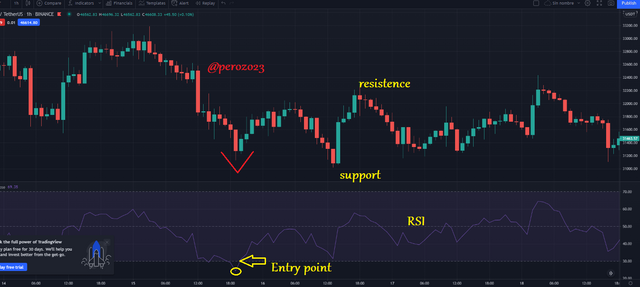
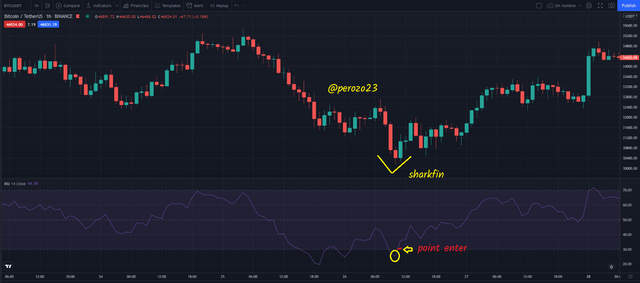
Example: BTC/USDT 1hour
We see on the RSI that the line is below 30 so when the again touches the 30 point is my buy position to be able to trade the market I go to a profit of 1:1 this way have a good risk management in case the trade turns around find.
Source
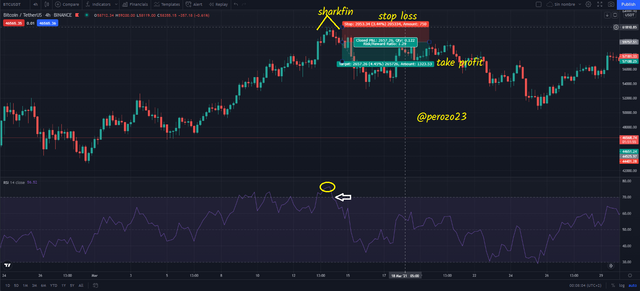
Let's see the same chart but in reverse and this is used to go short or simply protect our investment from market volatility and not get caught in the operation or worse be liquidated. for this example I will demonstrate on the graph as the RSI is displayed.
We see that the price exits the 70's and then returns when it touches the 70's again that is the point of entry short or exit as we will avoid false signals and protect us from market volatility if we go short we can get profits 1:1 to manage the risk and avoid losses if the operation is returned.
We also see that previously it went out of the 70's and tried to touch the 70's line but did not touch it but went back up but when it came back and touched the 70's it was our confirmation entry to take positions.
Source
Write the trade entry and exit criteria for trading the shark fin pattern (clear charts are required)
Buy position entry criteria
Understand the shark fin with the signal that gives us the RSI is to say that when the band is lower than 30 there is an oversold while when the signal is above 70 there is an overbought values usually correct quickly at those points at the inverse level.
Have the RSI indicator with the default lengths i.e. 14 periods and the bands at 30 for the lowest and 70 for the highest.
Define entry points in both long and short trades or simply protect our investment with the shark fin can be made several desired operations taking into account the periods of the RSI for greater security.
Source
Sale position entry criteria
When the RSI period is above 70 and the shark fin pattern is formed is the ideal point to trade exactly when it touches the 70 point again that way we avoid false movements.
To understand the shark fin with the signal that gives us the RSI is to say that when the band is lower than 30 there is an oversold while when the signal is above 70 there is an overbought values usually correct quickly at these points at the inverse level.
Have the RSI indicator with the default lengths i.e. 14 periods and the bands at 30 for the lowest and 70 for the highest.
Define entry points in both long and short trades or simply protect our investment with the shark fin can be made several desired operations taking into account the periods of the RSI for greater security.
Source
Exit criteria for the buy position
a) risk management place stop loss take entry and exit positions it is recommended that the reward is the same 1:1 risk.
b) If the trade does not trigger the stop losses then the trade is no longer valid we must find another entry.
c) The exit point should be placed below the voucher before the shark fin.
d) Place take profit in case everything goes well.
Source
Exit criteria for the sell position
We need to identify entry and exit points in order to place stop losses so as not to lose money if the chart reverses to meet our prediction.
Define entry points in both long and short trades or simply protect our investment with the shark fin can be made several desired trades taking into account the periods of the RSI for safety.
If somehow the stop loss is triggered it means that the trade is cancelled and we must look for another entry point.
Taking advantage of the take profit if the operation goes well we will obtain great profits at low risks.
Source
Perform at least 2 trades based on the shark fin pattern strategy (trading together with clear charts is required)
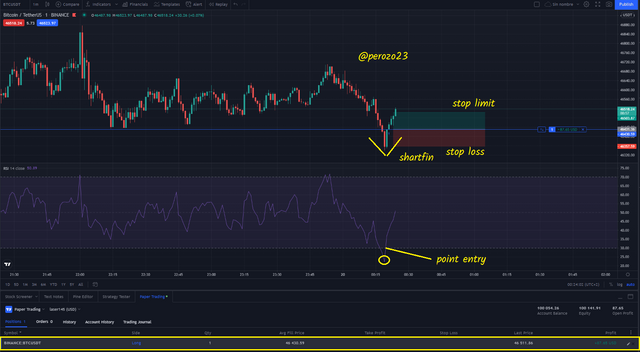
BTC/USDT 1min chart to demonstrate how to trade in real time looking at the RSI indicator I see it below the 30 length so I wait for it to touch the 30 point again to enter trade once entered I manage the risk at 1:1 losses so I will place my stop loss below the previous candle and my stop limit at the same distance of the stop loss so it would be a 17% or so rise to exit with profit and so it was.
I bought 1 btc at 46.430,59USDT
Sold 1 btc at 46.511,86USDT
Total profit. 87.65 USDT on the final trade
Source
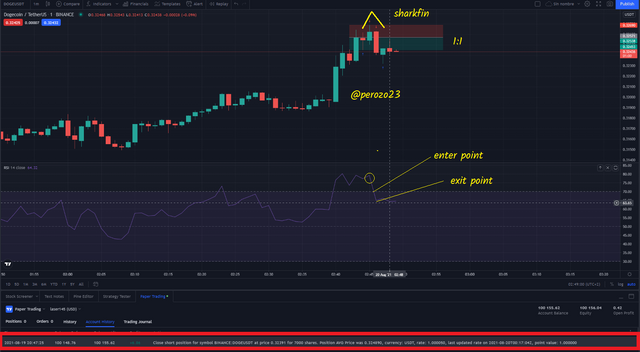
Second example:
Make a SHORT 7000 DOGE/USDT
Start of trade DOGE/USDT value = 0.32489
End of trade DOGE/USDT value = 0.32391
Earning in this move in 1min timeframe totaling +6.86USDT
And this was done by trading 1:1 using the risk factor rule.
Looking at the RSI was above 70 then that indicates me overbought in the 1min chart especially to perform this example in short time frame. so when the price touched the 70 point of the chart I went short and taking advantage of the fall I could get profits very quickly.
Source
Conclusion:
The shark fin pattern strategy, is very effective as it allows differences false movements in conjunction with the RSI is a very necessary tool for all traders, allows us to see corrections in strategic times of the market that we want to operate in this way giving a clear signal of entry or exit according to our need at the time of use. to use it in the best way it is important to use the default characteristics of the RSI 14.30.70. remember if the RSI signal is below 30 this means that at that time it is oversold and if we see the SHARKFIN pattern is formed is a clear entry signal looking for a long but if we see the RSI above 70 and we see that it returns quickly and in the graph is formed a SHARKFIN pattern then it is a clear entry signal. SHARKFIN pattern then it is time for two things one is either to enter short trades or exit trades and protect the assets the important thing is that we always learn something new and very productive as we see in the two previous exercises profits and 0 losses using the SHARKFIN pattern and the RSI.
THANK YOU:
Cc: @criptokraze
by: @Perozo23