Steemit CryptoAcademy Season 3 Week 2 HomeWork Task for @reminiscence01-Beginner’s Course:Introduction to charts
Hello everyone hope you are all doing great .its a great pleasure to be among the lucky ones to participate in this homework task .
Great appreciation go to @reminiscence01 for coming up with this great task about Japanese candlestick chart and the following below is my own understanding about this topic

Explain the Japanese candle stick chart?
What is a chart
• A chart refers to way data is being graphically represented for example inform of symbols , lines .
Types of charts include the following
Bar charts , line charts, column charts and many others.
Bar charts
Bar charts are charts that represent data in form of rectangular bars.Line charts
These are charts that are represented inform of lines.
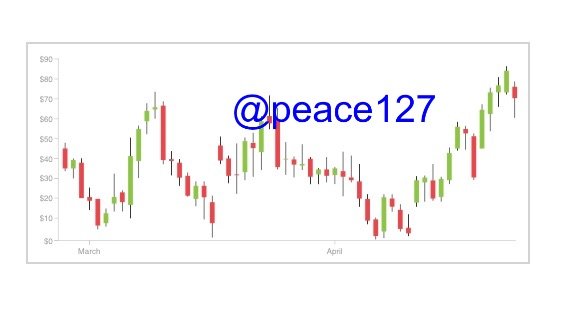
What is a Japanese candle stick chart
- This is a chart which describes the price movement of currency by showing the opening and closing, high and low points for a given period of time.
NOTE
- When reading a Japanese candle stick chart you should note the following.
The chart setting depends on the candle color, so if the candle color is green, it means that the price is moving upwards because the price of the candle is closing above the opening price of the candle and if the candle color is red, it means that the price is moving downwards because the price candle is opening above the closing price of the candl
In the Japanese candle stick chart we have got two features which include the following
- BULLISH CANDLE STICK CHART
This candle stick is green in color which indicates an uptrend movement for prices in the chart.
- BEARISH CANDLE STICK CHART
This a chart that is red in color which indicates a down trend movement of prices in the candle stick chart.
The Japanese candle stick chart has five stages which include the following
1 . Opening price
This means the price of an asset that is first traded and price movement that begins in a given period of time.
2 . High price
This shows the highest price recorded of an asset in a given period of time.
3 . Low price
This shows the lowest price recorded of an asset in a given period of time.
4 . Closing price
This price represents the last price movement recorded of an asset in a candle chart in a given period of time.
5 . Shadow price
This indicates the up and down price movement of an asset on the candle link chart in a given period of time.
Describe any other two types of charts(screen shots required)
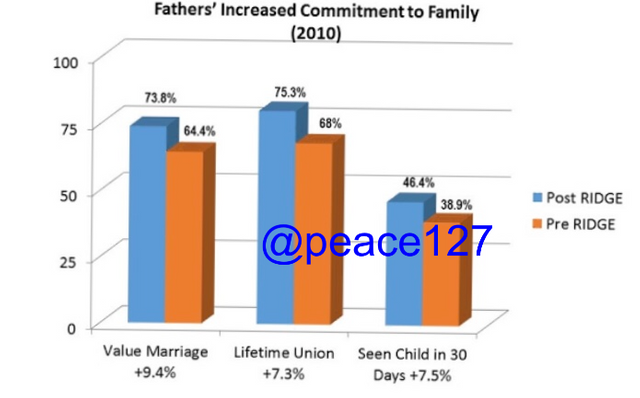
- Bar charts
This refers to a chart that represents data inform of rectangular bars.
A bar chart has both the X and Y axis which you can plot using two different colors Like red and green
A bar chat is very easy to read and understand since it displays all the information a trader needs to know in form of rectangular bars
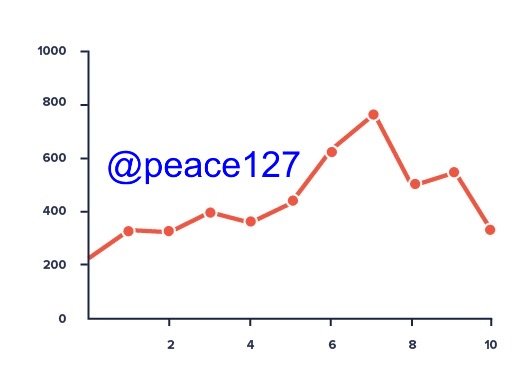
- Line chart
A line chart is a chart that displays its data in form of lines which runs from the X axis to the Y axis
A line chart or graph helps to interpret data easier
A line graph shows all the trends in market price
A line chart or graph is easy to interpret and understand
In your own wards , explain why the Japanese candle stick chart is mostly used by traders?
According to me I think the candle stick chart is mostly used by traders due to the following reasons below
The Japanese candle stick chart shows the actual movement of the price of an asset at a given period of time.
The candle stick chart shows the important price points being recorded and the various movement of the prices in a given period of chart that’s why most traders prefer to use it.
The chart shows a relationship between buyers and sellers in the market price as data is displayed for the traders
The chart shows a relationship between buyers and sellers in the market price as data is displayed for the traders
The chart is easy to read and interpret
The Japanese candle stick chart provides the exact results to the sellers and buyers or traders since the price movement of assets being traded are well displayed on the charts for all the traders to view , read and understand.
The Japanese candle stick chart shows the price movement of an asset being traded in a given period of time.
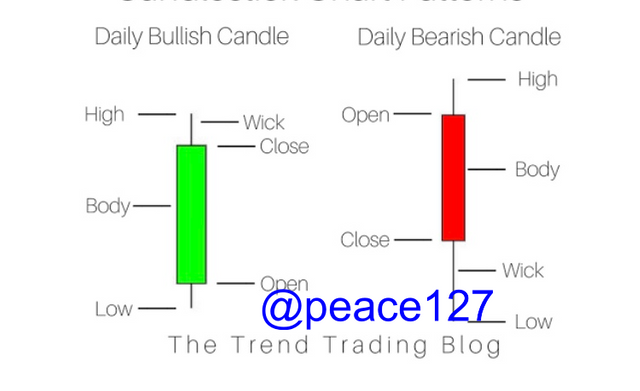
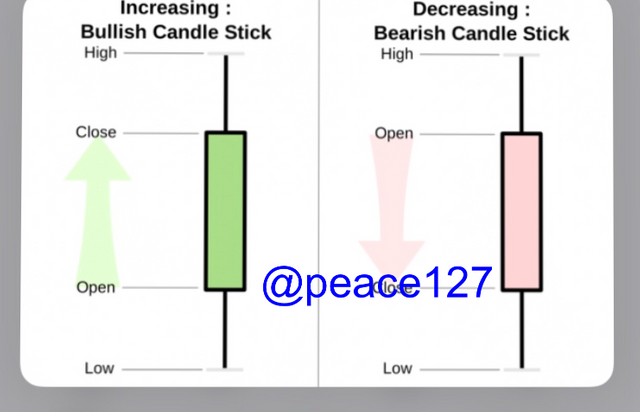
Describe a bullish candle and a bearish candle identifying its anatomy (screen shots required)?
- BULLISH CANDLE
This is a candle that is green in color ,
which indicates an uptrend movement of prices recorded of an asset in the candle stick chart .
It also indicates an increase in the price movement
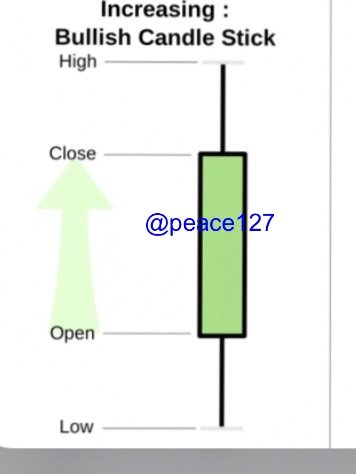
The opening price is on the bottom of the closing price showing an increase in the assets traded .
Highest price is on top showing the highest price recorded of a traded asset in a given period of time .
Lowest price is on the stream bottom showing the lowest price recorded of a traded asset in a given period of time.
Closing price shows the last price movement of a recorded traded asset in the chart at a given period of time.
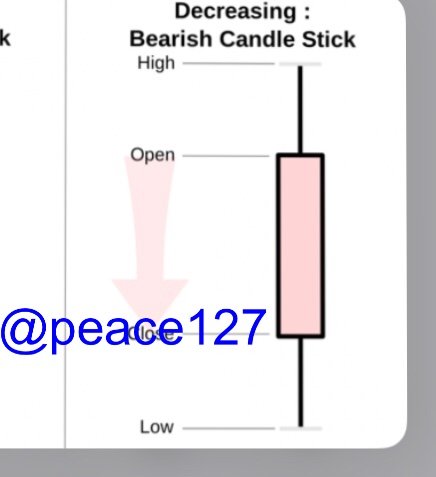
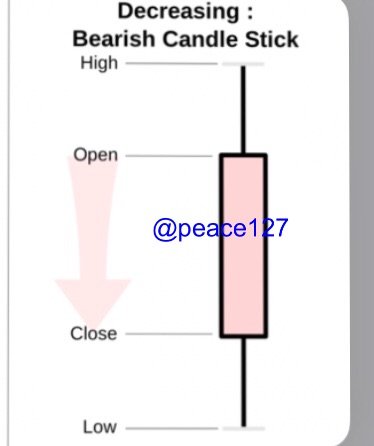
BEARISH CANDLE
Bearish candle is red in color which indicates a down trend movement of price of a recorded traded asset in the candle chart in a given period of time . It shows a decrease in the price movement.
The closing stock is on the bottom of the opening price showing a decrease in the price movement of an asset traded in a given period of time .
The low price
The low price shows the lowest price recorded of a traded asset on the candle stick chart in a given period of time .The high price
The price shows the highest price recorded of a traded asset on the candle stick chart in a given period of time.
ANATOMY OF BULLISH AND BEARISH CANDLES
Differences between bullish and bearish
Bullish candle is green in color while bearish candle is red in color.
Bullish candle has an uptrend movement of prices in a given period of time while bearish has a downtrend movement of prices in a given period of time.
Bullish indicates an increase in price movement while bearish indicates a decrease in the price movement in a given period of time.
Similarities
Both the bullish and bearish have a low point price of a recorded traded asset in the given period of time
Both the bullish and the bearish have a high point price of a recorded traded asset in a given period of time
CONCLUSION
In conclusion, Japanese candle stick chart is a very good chart that traders should use in order to know the price movements of recorded assets that are traded in a given period of time.
Japanese candle stick chart has helped traders to easily read the chart and understand when to buy and also when sell
The chart also helps the traders when to know when there is an increase in the price movements because the color will be green and if there is a decrease in the price movement the color will be red also the same as bearish.
Thank you professor for this wonderful class study
C.c @reminiscence01