Homework-Task 2 || How To Read Candlestick Charts In Different Time Frame & Information about Buy-Sell. (@stream4u) - Cómo leer los gráficos de velas en diferentes marcos de tiempo y la información sobre la compra y venta by @pablo1601
[English]
Good afternoon to all #SteemitCryptoAcademy students!
Here I am getting ready to do my homework for the second week's class from the teacher @stream4u.
Trading is an activity in which investors try to make a profit from the purchase and sale of different assets that are characterised by high liquidity, such as stocks, bonds, derivatives, futures, commodities and cryptocurrencies.
Before I start, I would like to tell you that I identify myself as a swing trader, although I sometimes practice scalping. I believe that clarifying what my trading preferences are will help to clarify the approach I will take to my task.
1 - Explain what is the meaning of the green and red candlestick and how to read the green and red candlestick image with candles (screenshot needed).
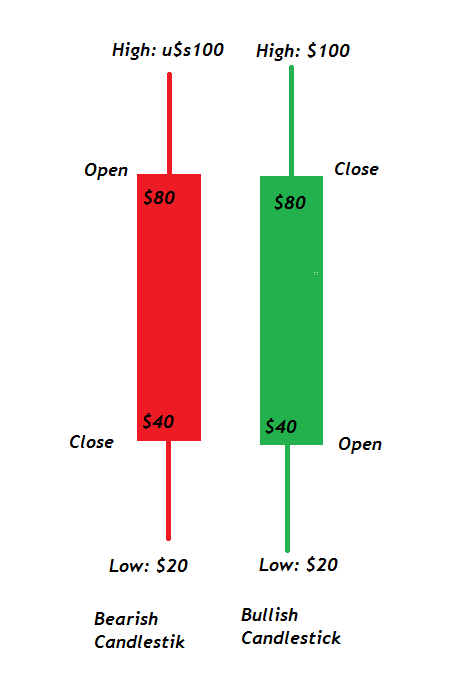
The red candlestick indicates that the price of the currency opened at $80, closed at $40, had a high of $100 and a low of $20. This candlestick indicates a downtrend, as the closing price is lower than the opening price.
The Green candlestick indicates that the price for the selected timeframe opened at $40, and closed at $80. However, it had a low of $20 and a high of $100.
Clearly this candle marks an uptrend because it closed at a higher price than the opening price for the time frame we are working with.
The candlesticks give us very important information about the price behaviour of an asset for the time frame we are working on.
2 - Explain with the candlestick chart, what are the available time frames we can set on the chart and why is it necessary to change the time frame of the candlesticks? (Screenshot needed)
If we go to Tradinview and choose some cryptocurrency we can see that for the same asset we can set different timeframes, from 1 sec to 1 month.
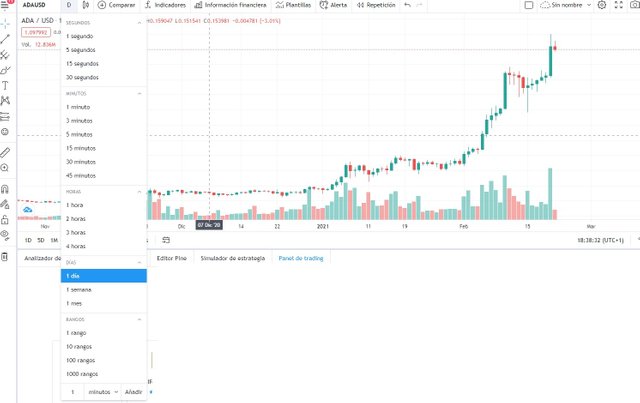
For each of these timeframes we can see the behaviour of the price in the graph of each of the candlesticks, i.e., how much it opened, how much it closed and what were its high and low points.
In this case to show the evolution of the timeframes I chose the ADA currency, as it seems to me one of the projects with the greatest future in the blockchain world.
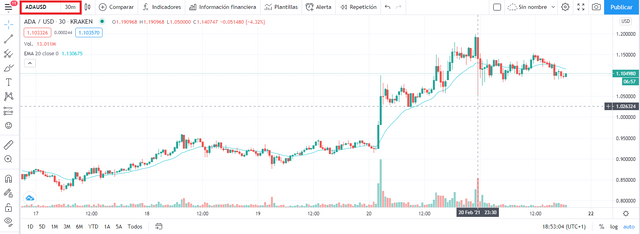
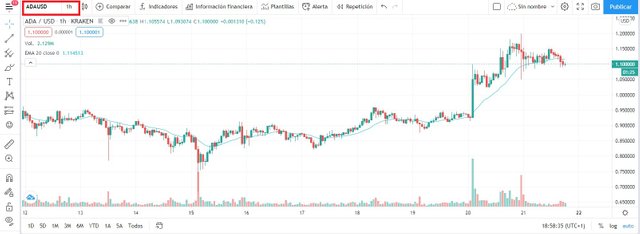
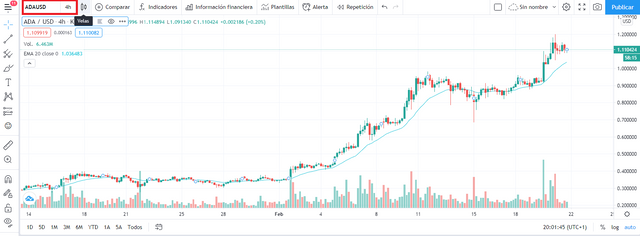
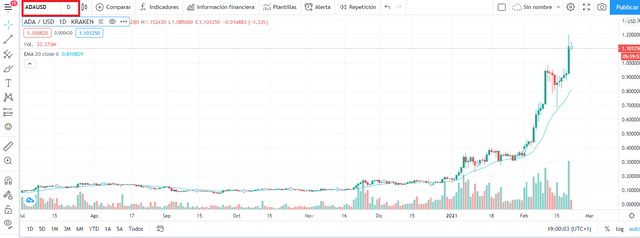
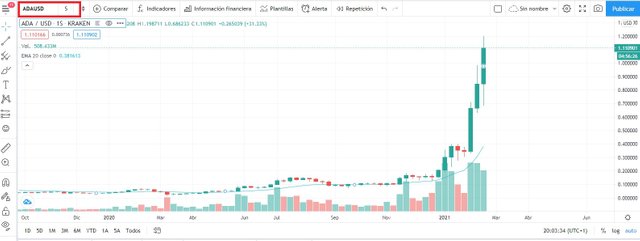
In the graphs of the different time periods we can see that depending on the time period analysed, the trend is different.
I usually do a 1 day timeframe analysis to see the general trend and then I start to analyse smaller timeframes such as 4 hours, 1 hour, 30 minutes and 5 minutes. I usually include the EMA(20) in my charts to know which point to look for in case of a rise or fall.
In the charts of the different time frames we can see how the lower time frames show a more sideways trend and as we go up in the time frames the trend is clearly bullish.
The chart of the time frame to use will depend on the type of trading we decide to do or the type of trader we are. If we are short term traders we will probably use 5, 15, 30 minutes time frames.
If we are long term traders we will probably use charts with 1 day or weekly candlesticks.
3 - Show any particular asset candlestick chart on a different time frame and briefly explain what you see on the chart, such as what trend we see, what the price levels are. (Screenshot required)
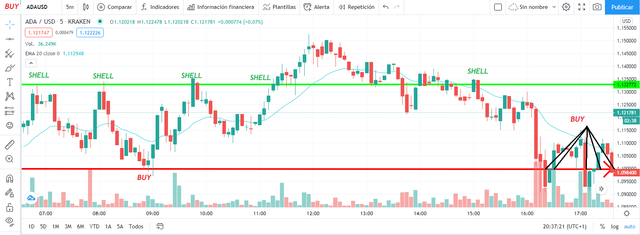
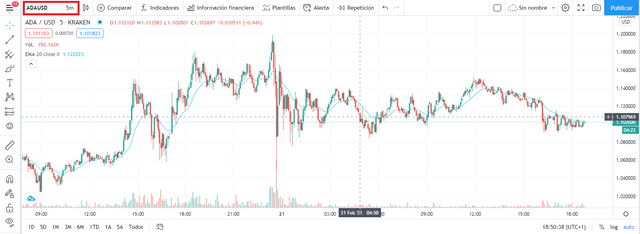
The chart shows that prices oscillate mostly in the range set between support (red line) and resistance (green line). When the price is falling and contact is made with support that marks a buy point.
When the price of the asset is rising and makes contact with support it is a sell confirmation.
It is important to mark at least 5/6 horizontal lines to be able to do a more precise job and above all to be able to visualise when a resistance becomes a support in an uptrend and when a support becomes a resistance in a downtrend.
4 - What types of traders are available in the market and how do they work?
We have 4 types of traders:
Intraday trading
Here we have two types of strategies: Scalping and intraday swing trading, which although it closes positions on the same day usually takes a little longer (5 minutes to 2 hours) than scalping.
This type of traders make their trades during the day. Scalping consists of opening and closing trades in a few minutes, trying to make small amounts of profit numerous times throughout the day.
Scalpers require a lot of technical knowledge and it is a risky and aggressive technique.
Day Trader
Daytrading is similar to scalping in that the trades are made on the same day, but the trades are not closed within minutes, but take two hours before closing the sale. This type of trading is used by traders who do not want to wait until the next day to know the result of their trades.
Traders who apply this type of trading are not characterised by patience and therefore bet on closing their positions on the same day.
Swing Trading
This is medium-term trading, with several days passing between opening and closing a position. This strategy is for more patient and disciplined investors and requires the patience and confidence of traders to hold positions if there is a temporary drop in prices.
Several weeks may elapse between buying and selling.
Position trading
Here trades can remain open for several months. Traders require a great deal of patience, a great deal of knowledge of the market and a great deal of technical and fundamental analysis.
It is also very important to know how to discriminate the information that is going around in the ecosystem, nor should you be very influenced by other traders.
Here the analysis is done by the trader himself and he trusts his work. This is a long-term job.
Now knowing this we are in conditions to decide what kind of traders we are going to be, taking into account the mentioned characteristics and which of these characteristics we recognise in our personality.
I want to share with you a phrase that I heard a long time ago and it seems to me very clear to try to be a good trader and it goes like this;.....
... "In trading, the patient investors take the money of the impatient ones"....
And this is very true; remember that the financial markets are manipulated by those who have more economic power to manage to keep the money of those who sell their positions when the currency shows only a small drop...
5 - When trading or investing in assets, what is the importance of support and resistance, explain how they work?
The supports and resistances are essential when trading because they are those levels (lines) in which the price of an asset bounces in several opportunities, but they can be crossed.
Supports indicate that when we have a downtrend, the price of the asset goes down to a certain point from which prices start to bounce as if rejecting the price to go lower than those levels. Sometimes prices can break through these supports in such a way that they end up becoming resistance.
The same happens with resistances, when we are facing an uptrend. Prices tend to rise up to a certain level beyond which the market starts to reject them and makes them stay in a more or less stable price range.
Supports and resistances act as a kind of a ceiling that keeps prices in there, but nothing prevents them from being breached and a resistance becomes a support and a support becomes a resistance.
It is important to bear in mind that the supports and resistances marked in higher time frames have more strength than those marked in lower time frames where the supports and resistances are usually more fragile.
THE IMPORTANCE OF THE SUPPORTS AND RESISTANCES IS THAT THEY MARK THE POINTS OF PURCHASE AND SALE RESPECTIVELY WHEN LOWS OR RISES ARE REGISTERED IN THE PRICES OF AN ASSET. IT IS WORTH CLARIFYING THAT THIS IS USED IN FRONT OF OTHER INDICATORS THAT CAN INDICATE THE TENDENCY THAT THE ASSET CAN HAVE.
6 - How can we find support on the candlestick chart, explain with one of the asset candlestick charts with screenshot and point out the levels. (Screenshot needed)
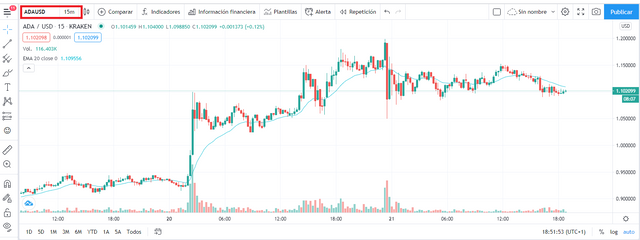
In the charts we can find the supports by looking at the points where when the price of the asset falls to a certain point from which the prices bounce upwards.
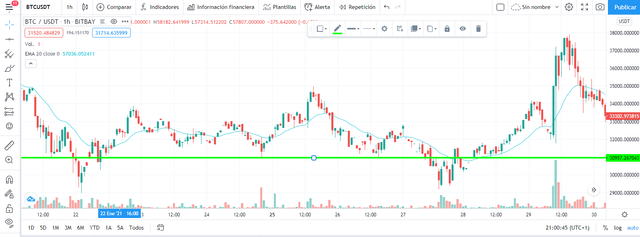
Recall that support is a point at which the price stops its decline and starts to rise again.
It is important to remember two things:
- Supports and resistances are more sources for higher timeframes.
- The more times the price returns on a support or a resistance, the more strength they will have.
7 - After finding support, when and where should we place a buy order? Explain with a screenshot of the chart? (Screenshot needed)
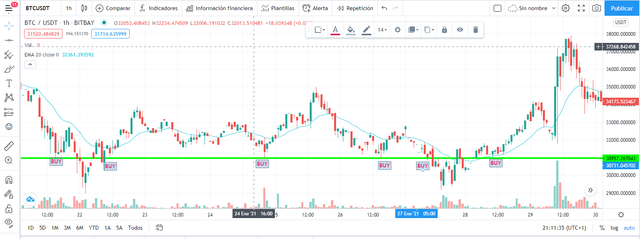
To set buy points we must be vigilant and patient for the price to move down to the point of resistance. Once prices drop to that level we can place our buy order.
The use of support and resistance to place our buy and sell points is vital to successful trading.
Follow @steemitblog to keep up to date with the latest news.
Thank you @steemcurator01 and @steemcurator02 for the support you constantly give to the whole community.
###[ Español]
Muy buenas tardes a todos los estudiantes de la #SteemitCryptoAcademy!
Aquí estoy disponiéndome a realizar las tareas de la clase de la segunda semana del profesor @stream4u.
El trading consiste en una actividad en la que los inversionistas intentan obtener una ganancia de la compra venta de diferentes acticos que se caracterizan por tener una gran liquidez, como pueden ser las acciones, bonos, derivados, futuros, materias primas y cryptomomnedas.
Antes de comenzar quiero comentarles que me identifico como un inversor que realiza swing trader, aunque en ocasiones practico el scalping. Creo que aclarar cuales son mis preferencias para tradear ayudará a aclarar el enfoque que le daré a mi tarea.
1 - Explique cuál es el significado de la vela verde y roja y cómo leer la imagen de la vela verde y roja con velas (se necesita captura de pantalla).
La vela roja indica que el precio de la moneda abrio a $80, cerró en $40, tuvo un máximo de $100 y un mínimo de $20. Esta vela indica una tendencia bajista, ya que el precio de cierre es menor que el precio de apertura
La vela Verde indica que el precio para la temporalidad seleccionada abrió en $40, y cerró en $80. No obstante a ello tuvo un mínimo de $20 y un máximo de $100.
Claramente esta vela marca una tendencia alcista porque cerro en un precio superior al de apertura para la temporalidad en la que estamos trabajando.
Las velas nos brindan información muy importante del comportamiento del precio de un activo determinado para la temporalidad en que estamos trabajando
2 - Explique con el gráfico de velas, ¿cuáles son los marcos de tiempo disponibles que podemos establecer en el gráfico y por qué es necesario cambiar el marco de tiempo de las velas? (Se necesita captura de pantalla)
Si vamos aTradinview y elegimos alguna cryptomoneda podemos ver que para un mismo activo podemos configurar diferentesmarcos temporales, desde 1 seg. hasta 1mes.
Para cada una de esas temporalidades podremos ver el comportamiento del precio en la gráfica de cada una de las velas, es decir, a cunto abrió, a cuanto cerro y cuales fueron sus puntos máximos y mínimos.
En este caso para mostrar la evolución de las temporalidades elegí la modeda ADA, ya que me parece uno de los proyectos con mayor futuro dentro del mundo de las blockchain.
En los gráficos de las diferentes temporalidades podemos ver que según la temporalidad analizada, la tendencia es diferente.
Yo para realizar los análisis generalmente hago un análisis de temporalidad de 1 día, para ver la tendencia general y después comienzo a realizar análisis de temporalidades menores como por ejemplo puede ser de 4 horas, de 1 hora, de 30 minutos y de 5 minutos. A is gráficos generalmente les incluyo la EMA(20) para saber cual es el punto que irá a buscar en caso de un alza o una baja.
En los gráficos de las diferentes temporalidades podemos ver como en las temporalidades más bajas se muestra una tendencia más lateral y a medida que subimos en las temporalidades la tendencia es netamente alcista.
El gráfico de la temporalidad a ytilizar dependerá del tipo de trading que decidamos realizar o el tipo de trader que seamos. Si somos trades de corto plazo seguramente utilizaremos temporalidades de 5, 15, 30 minutos.
Si en cambio somos trader de largo plazo seguramente utilizaremos gráficos con velas de 1 día o velas semanales
3 - Muestre cualquier gráfico de velas de activos en particular en un marco de tiempo diferente y explique brevemente lo que ve en el gráfico, como qué tendencia vemos, cuáles son los niveles de precios. (Se necesita captura de pantalla)
El gráfico muestra que los precios oscilan mayormente en el rango fijado entre el soporte (línea roja) y la resistencia (linea verde). Cuando el precio está en baja y y se hace contacto con el soporte eso nos marca un punto de compra.
Cuando el precio del activo está en alza y hace contacto con el soporte es una confirmación de venta.
Es importante marcar al menos 5/6 líneas horizontales para poder hacer un trabajo más preciso y sobre todo para poder visualizar cuando una resistencia se convierte en soporte en una tendencia alcista y cuando un soporte se convierte en una resistencia en una tendencia bajista.
4 - ¿Qué tipo de traders disponibles en el mercado, explica cómo funcionan?
Tenemos 4 tipos de traders:
Trading intradía
Aquí tenemos dos tipos de estrategias: El scalping y el el trading intradía swing, que si bien se cierra posición en el mismo día suele durar algo más de tiempo (de 5 minutos a 2 horas) que el scalping.
Este tipo de traders realizan sus operaciones en el día. El scalping consiste en la apertura y cierre de operaciones en pocos minutos, tratando de conseguir pequeñas cantidades de beneficios en numerosas ocasiones a lo lardo del día.
Los scalpers requieren de mucho conocimiento técnico y es una técnica arriesgada y agresiva
Day Trader
El Daytrading es similar al Scalping ya que las operaciones se realizan en el mismo día, pero las operaciones no se cierran en minutos, sino que tardar dos horas antes de cerrar la venta. Este tipo de trading lo realizan aquellos traders que no quieren esperar hasta el próximo día para conocer el resultado de sus operaciones.
Los traders que aplican este tipo de trading no se caracterizan por tener paciencia y por ello apuestan a cerrar sus posiciones en el mismo día.
Swing Trading
Aquí se opera en mediano plazo, pasando varios días entre que se abre y se cierra la posición. Esta estrategia es para inversores más pacientes y disciplinados y requiere de la paciencia y la confianza de los traders para conservar las posiciones si sucede alguna caída transitoria de los precios.
Entre la compra y la venta pueden llegar a pasar varias semanas.
Position trading
Aquí las operaciones pueden permanecer abiertas por varios meses. Los traders requieren de gran paciencia, muchísimo conocimiento del mercado y en análisis técnico y fundamental.
También es muy importante saber discriminar la información que anda dando vueltas en el ecosistema, ni tampoco debes ser muy influenciable por otros traders.
Aquí quién realiza el análisis es el propio trader y el mismo confía en su trabajo. Aquí se hace un trabajo a largo plazo.
Ahora sabiendo esto estamos en condiciones de decidir que tipo de traders vamos a ser nosotros teniendo en cuenta las características mencionadas y cuales de esas características reconocemos en nuestra personalidad.
Quiero compartir con ustedes una frase que escuché hace mucho tiempo y me parece muy clara para intentar ser un buen traders y dice así;...
..."En el trading los inversores pacientes se quedan con el dinero de los impacientes"...
Y esto es bien cierto; recuerden que los mercados financieros son manipulados por quienes detentan mayor poder económico para lograr quedarse con las el dinero de quienes venden sus posiciones cuando la moneda apenas muestra una pequeña baja...
5 - Al comerciar o invertir en activos, ¿cuál es la importancia del soporte y la resistencia, explique cómo funcionan?
Los soportes y resistencias son esenciales a la hora de hacer trading ya que son aquellos niveles (líneas) en lo que el precio de un activo rebota en varias oportunidades, pero pueden ser traspasados.
Los soportes indican que cuando tenemos una tendencia a la baja, el precio del activo baja hasta cierto punto a partir del cual los precios comienzan a rebotar como si rechazaran que el precio baje más que esos niveles. En ocasiones los precios pueden atravesar esos soportes de manera que terminan convirtiéndose en resistencias.
Lo mismo sucede con las resistencias, cuando estamos frente a una tendencia alcista. Los precios tienden a subir hasta cierto nivel a partir de los cuales el mercado los comienza a rechazar y hace que se mantengan en un rango de precios más o menos estables.
Los soportes y las resistencias actúan como una especie de cota que hace que los precios se mantengan allí adentro, pero nada impide que estos sean traspasados y una resistencia pase a transformarse en un soporte y un soporte en una resistencia.
Es importante tener en cuenta que los soportes y resistencias marcados en temporalidades más altas tienen más fuerza que los marcados en temporalidades más bajas donde los soportes y resistencias suelen ser más frágiles
LA IMPORTANCIA DE LOS SOPORTES Y LAS RESISTENCIAS ES QUE NOS MARCAN LOS PUNTOS DE COMPRA Y VENTA RESPECTIVAMENTE AL REGISTRARSE BAJAS O ALZAS EN LOS PRECIOS DE UN ACTIVO. VALE ACLARAR QUE ESTO SE UTILIZA FRENTE A OTROS INDICADORES QUE NOS PUEDEN LLEGAR A INDICAR LA TENDENCIA QUE PUEDE LLEGAR A TENER ESE ACTIVO.
6 -Cómo podemos encontrar el soporte en el gráfico de velas, explicar con uno de los gráficos de velas de activos con captura de pantalla y señalar los niveles. (Se necesita captura de pantalla)
En los gráficos los soportes los podemos encontrar mirando los puntos en los cuales cuando el precio del activo cae hasta cierto punto a partir del cual los precios rebotan hacia arriba.
Recordemos que el soporte es un punto en el cual el precio frena su descenso para volver a subir.
Es importante recordar dos cosas:
- Los soportes y resistencias son más fuentes para temporalidades más altas
- Cuanto más veces revota el precio en un soporte o una resistencia más fuerza tendrán estos.
7 - Después de encontrar soporte, ¿cuándo y dónde debemos realizar un pedido de compra? ¿Explica con una captura de pantalla del gráfico? (Se necesita captura de pantalla)
Para fijar los puntos de compra debemos estar atentos y ser pacientes a que el precio baje hasta el punto de la resistencia. Una vez que los precios descienden hasta ese nivel podemos colocar nuestro orden de compra.
La utilización de soportes y resistencias para colocar nuestros puntos de compra y de venta es vital a la hora del éxito en el trading.
Segui a @steemitblog para enterarte de las novedades que se vayan sucediendo
Gracias @steemcurator01 y @steemcurator02 por el apoyo que dan constantemente a toda la comunidad
Perfect.
Thank You For Showing Your Intrest in Steemit Crypto Academy
You have completed the homework task and made a good post, explained very nicely about How To Read Candlestick Charts In Different Time Frame & Information about Buy-Sell(Support &
Resistance).
Remark: Homework Task Completed.
Thank You.
@stream4u
Crypto Professors : Steemit Crypto Academy
#india #affable