Introduction to the Principles of Crypto Analysis - Crypto Academy S4W7 - Homework Post for @imagen
Hello everyone;
Today we have introduced fundamental and technical analysis for cryptocurrencies. I highly recommend anyone interested in the subject to read this tutorial by @imagen, which is very helpful.

1.) What are the differences between Fundamental Analysis and Technical Analysis? Which one is used most often?
An investor in cryptocurrencies uses one of two analysis methods when deciding on trading decisions. These are fundamental analysis and technical analysis. Many investors combine these two types of analysis and decide accordingly. In fact, this is perhaps the most likely way to lead investors to success. However, depending on the preferences of the investors, there are many investors who only do fundamental analysis or only technical analysis.
Before comparing these two concepts, I would like to briefly talk about what these two concepts are.
In fundamental analysis, the general characteristics of any commodity are examined in every aspect.
In order to make a fundamental analysis of a crypto asset, it is necessary to examine the project of this crypto in depth. Data such as for what purpose this crypto is used, the user portfolio, who is the project team and what is their target should be examined.
In the traditional stock market, fundamental analysis is used to calculate the true value of the company. The financial statements of the company are examined in detail. But if we are talking about crypto markets, the concept of fundamental analysis will also change. Because when it comes to cryptocurrencies, there is decentralization. For this reason, if fundamental analysis is to be made for cryptocurrencies, the factors to be considered will change.
The main factors to be considered in fundamental analysis are as follows.
- Blockchain Analyses (Onchain Analyses)
- Financal Metric Analyses
- Project Analyses
On the other hand, graphics come into play in technical analysis. It is estimated how the relevant asset will behave in the future based on its past prices. There are many technical analysis methods. There are many different technical analysis tools such as technical indicators, Fibonacci retracements, candle patterns, trends, which we often examine in crypto academy classes.
With technical analysis, you can see the signals of price movements and decide on the overbought-sold zones. Sometimes technical analysis tools explain price action with a delay, and sometimes they predict price action for the future.
Differences Between Fundamental Analysis and Technical Analysis
The first and I think the most important difference is that the value of the commodity is determined in fundamental analysis. In other words, it is decided whether to invest in this commodity or not. In technical analysis, the price movements of the commodity are examined. It is looked at how the price of the commodity will move, whether it will increase or decrease.
The information required for fundamental analysis is different from the information required for technical analysis. Fundamental analysis requires in-depth knowledge of the project. A lot of information is needed, such as the number of transactions made, the number of wallets owned, future projects of the blockchain, the project team, and the market volume. But on the other hand, it will be sufficient to know only the past price movements of that asset for technical analysis.
Technical analysis has a more fragile structure. Price movements can change quite easily. Even a speculation on social media easily affects prices. In fundamental analysis, such speculations or information do not matter.
Technical analysis is mostly done using mathematical equations. The results for investors are generally the same. In technical analysis, if the RSI is showing 70, it's the same for everyone. In fundamental analysis, on the other hand, more relative results can be obtained. For example, the project of the related blockchain may be very innovative for me, while another person may not find this project functional.
The interpretation of the data in fundamental analysis is simpler for an ordinary investor. For technical analysis, more technical knowledge and experience is required. While it is possible to be fooled by the manipulations of whale investors in technical analysis, this is not the case in fundamental analysis.
Fundamental analysis is generally used more frequently in long-term investments, while technical analysis is more preferred for short-term investments.
It is quite difficult to give a clear answer to the question of whether Fundamental analysis or Technical analysis is used more. There are many factors that affect this. As we mentioned in the differences between these two analysis types, the answer will vary even for short-term investments or long-term investments. However, although fundamental analysis requires a lot of information, it is easier than technical analysis. While even beginner traders like me can do fundamental analysis in some way, we need more experience in technical analysis. It is therefore possible that fundamental analysis is more common.

2.) Choose one of the following crypto assets and perform a Fundamental Analysis indicating the objective of the Project, Financial Metrics and On-Chain Metrics. Cardano (ADA), Solana (SOL), Terra (MOON), Chiliz (CHZ), Polkadot (DOT)
I chose Solana(SOL) to answer this question.
While performing the fundamental analysis of the SOL coin, we will examine this coin under three main headings.
Solana Blockchain is a project that emerged as a solution to the scalability problem in Bitcoin and Ethereum projects. The two largest blockchain projects, Bitcoin, use Proof of Work (PoW) as the consensus mechanism, while Ethereum uses Proof of Stake (PoS). Solana, on the other hand, uses the innovative approach they call Proof of History together with the Consesus mechanism, PoS. Thus, a block is produced in 0.5 seconds. The project team claims that the Solana blockchain is the fastest blockchain.
One of the founders of the project is Anatoly Yakovenko, who is also the CEO of the Solana Foundation. When we look at Yakovenko's career, we see that he has worked in world-renowned companies such as Dropbox and Quallcomm. This creates an environment of trust.
The native token of Solana blockchain is SOL coin. This coin can be used for transactions and staking on the blockchain.
More than 350 projects have been produced on the Solana blockchain so far. The types of these projects vary. These projects are in various classifications such as NFT projects, DEX, DeFi, dApp, tools, exchanges.
Another striking point about the project is the game "Break Solana" created by the Solana team. With this game, users are trying to crack the code of the Solana blockchain. Those who succeed in this will be awarded prizes, but the fact that no one has succeeded so far shows how successful the project is.
For metric analysis, it would be challenging for an ordinary user to access this data. However, websites such as coinmarketcap.com are very helpful for this job. I used this website while doing the metric analysis of the SOL coin. Data such as Market Capitalization, Liquidity, Circulating Supply, Total Supply, Maximum Supply are generally required for financial metric analysis.
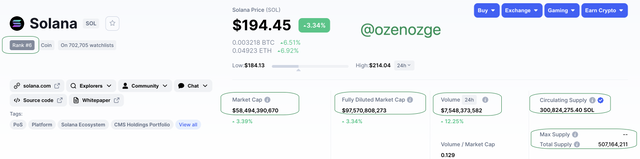
While I was answering this question, the Sol coin was **ranked 6. The price is instantly 194.45 USD. Other important data are Market Cap 58,494,380,670 USD, Fully Diluted Market Cap 97,570,808,273 USD, 24-Hour volume (liquidity) 7,548,373,582, Circulating Supply 300,824,275.40 SOL and Total Supply 507,164,211.
As can be seen in the screenshot, Max Supply of SOL is not given. When I did some research on this, it was seen that the SOL coin was released to the market in a fixed amount. In other words, the amount of SOL released will not increase in the future. For this reason, when we subtract the 11 million SOL tokens burned from the 500,000,000 tokens that were first released, we can say that the remaining 488,630,611 SOL tokens are Max Supply of. But here I had some doubts because the total supply value was greater than the max supply value.
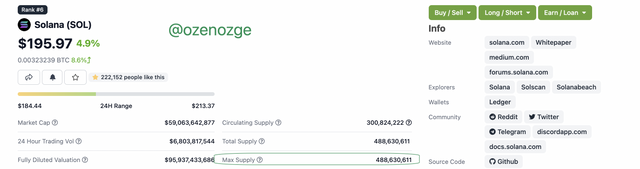
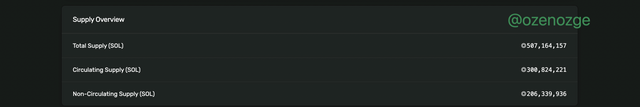
So to confirm, I also confirmed this value from Solana block explorer. Here, the total supply value is given as in the coinmarket cap. It seems that there is an information pollution on this subject. From this point of view, we can say that the total supply and max supply values are equal when the SOL coin supply is assumed to be constant.
Onchain Metric analysis concept can be defined as blockchain analysis. The data we will look at here is as follows;
The number of transactions carried out, block height the volume in staking.
First, I went to explorer.solana and found the number of transactions made so far. We said that the Solana blockchain claims to be the fastest blockchain. There is a transaction speed that confirms this. Even as I write this article, the number of transactions is increasing rapidly. What is more remarkable here is the Transaction Per Second (TPS) value. We see that around 2000 transactions are processed per second.
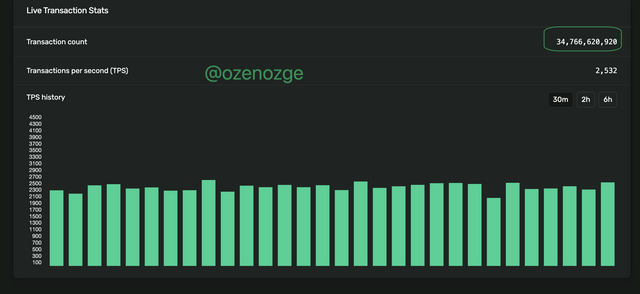
Just like the number of transactions, the block height value also increases. While writing this article, the block height value was 92,475,814.
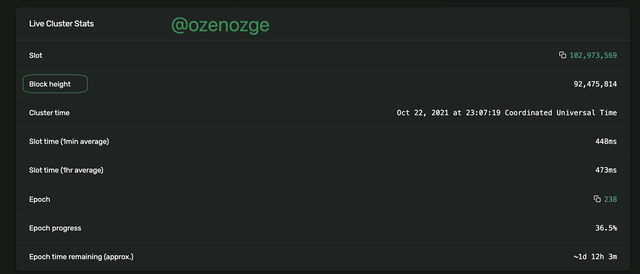
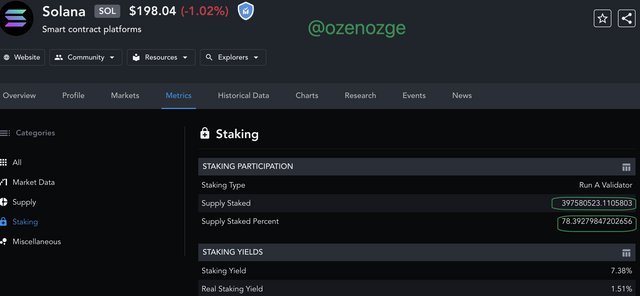
We mentioned that the Solana blockchain uses PoS as a consensual mechanism. The answer to the question of how many SOL coins were staked is not included in the Solana block Explorer. I was able to access the data I needed at messari.io . Around 39.7 Million SOL coin was staked.
3.) Make a purchase from your verified account of at least 10 USD of the currency selected in the previous point. Describe the process. (Show Screenshots).
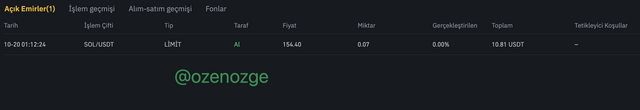
I purchased 0.7 SOL coin for 10.8 USD. For this, I logged into my Binance account. I typed the SOLUSDT pair on the search button. Afterwards, I examined the SOLUSDT chart and decided that 154.4 USD was the critical point and created a Limit Order from this point.
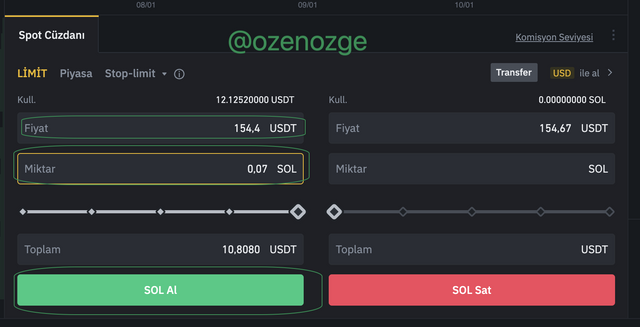
When I created this order, the SOL price was 155.3 USD. For this reason, I waited for a while for this order to be fulfilled.
After I made the purchase, there was a sudden increase in price and SOL coin rose to the levels of 170 USD the next day. I have to admit I regret not investing more here.

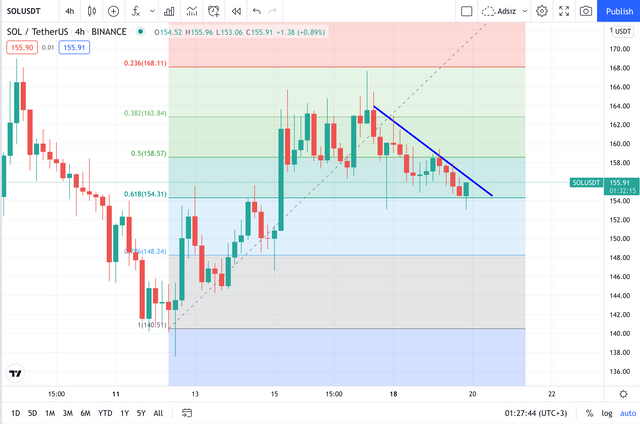
4.) Apply Fibonacci retracements to the previously selected asset with a 4 hour time frame on the platform of your choice. Observe the evolution of the price at 24 and 48 hours, did it go up or down in value? Look to identify resistance and support levels. (Show Screenshots at 0, 24 and 48 hours of purchase where the date and time are observed).
The screenshot below was taken after I got 0.07 SOL. According to the Fibonacci Retracement, it would either break the 0.618 point downwards or it was expected to not break this value and move upwards. As I had hoped, there was no downside breakout from this price and the price started to rise. When I took this screenshot, the date was October 20, 2021 at 00:20 local time. Also at this point the price was about to touch the downtrend. If it breaks this trend, a rise in price could not be avoided.
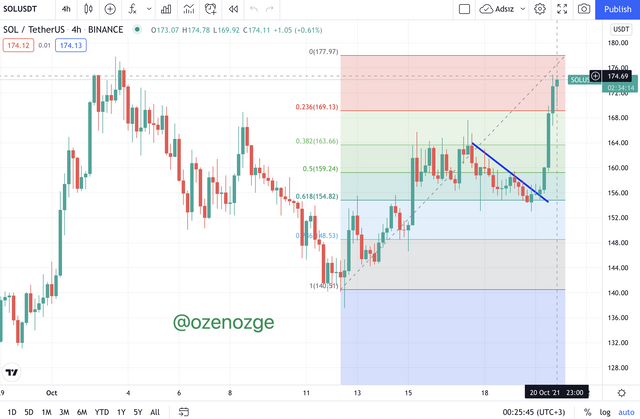
It has been about 24 hours since my SOL purchase. Below is the chart showing the price movements after making a purchase. As you can see, the graph continues to rise very successfully. It has exceeded the critical points one by one and has broken the trend upwards. My current goal will be to follow if Fibonacci will break the upper value or continue its rise. If the price starts to show a downward trend, I plan to sell my 0.07 SOL coins. But my current prediction is to see at least 178 USD levels.
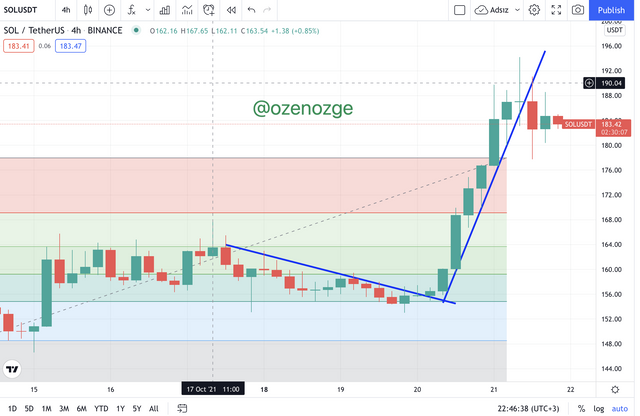
After 48 hours, the price of SOL has increased by approximately 30 USD. It is seen that the upward trend drawn after the price started to increase, started to be broken downwards. In addition, it is seen that it has exceeded the Fibonacci Retracement that I had drawn at the time I made the purchase. For this reason, the Fibonacci Retracement was drawn again to determine the selling point.
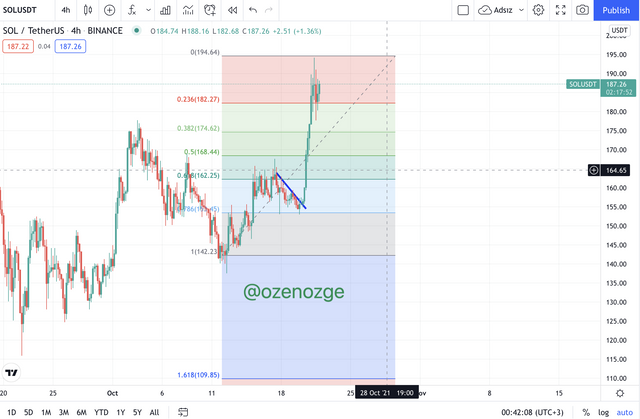
I removed the first Fibonacci Retracement I drew on the chart and drew the Fibonacci Retracement again according to the last prices. Here the price is at the level of 0.236. From here, I plan to sell if it breaks this level downwards. However, as we learned in our previous lessons, one should not make a decision based on a single element. It would be useful to evaluate it with a few indicators, to look at the trend direction, to look at the news about this coin and to see if there are developments related to the project.
5.) What are Bollinger Bands? How do they apply to Crypto Technical Analysis? With which other tool or indicator do you combine Bollinger Bands to analyze a Crypto? Justify your answer.
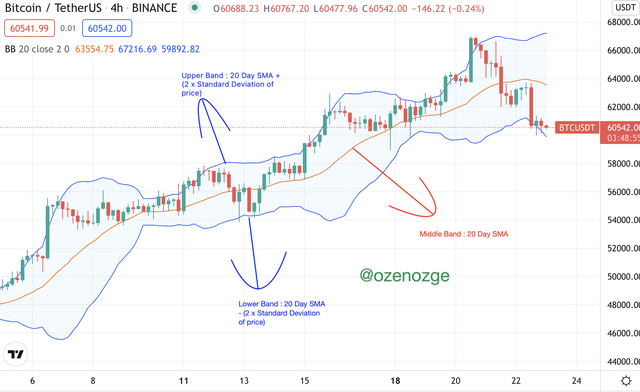
Bollinger Bands are a technical indicator and uses simple average, moving average and standard deviation. Bollinger Bands examine the volatility in the market, whether they are high or low.
In addition, these bands give signals that the prices are too low or too high. These bands consist of three separate bands. The middle band shows the 20-day simple moving average. The lower and upper bands are the bands in which the standard deviation is added to this simple moving average. The standard deviation used for the lower and upper bands can be changed according to the trader's preference. But in general they are +/- 2 standard deviations of the 20-day simple moving average.
Bollinger bands are interpreted in several different ways.
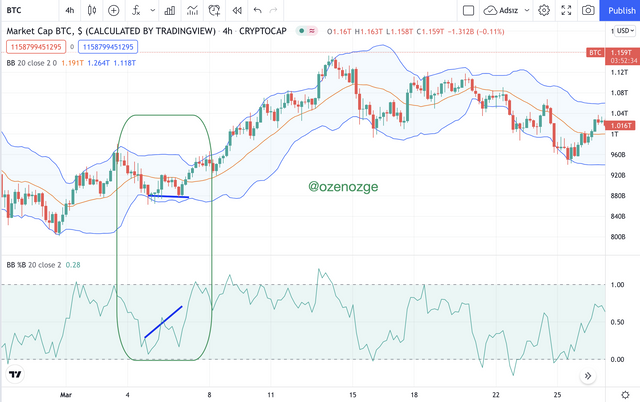
If the Bollinger band channel is too narrow, it is an indication that there will be a sudden change in price. This change can be either up or down. For example, as can be seen in the example below, a sudden increase was observed in the price after the band channel narrowed. This situation is called Bollinger Band squeeze.
Traders conclude that if the price exceeds the upper band, the price rises too much, and if it exceeds the lower band, it falls too low. Also, if the candlesticks touch the lower and upper bands a few times, it shows that the resistance/support points are strong at that point.
If the prices are trending from the middle band to the lower band, a decrease in prices is expected. On the contrary, if the prices are moving from the middle band to the upper band, an increase in prices is expected.
Most of the price movements take place within the Bollinger bands. When prices go out of these regions, it is an unusual situation and they do not give a buy-sell signal.
Bollinger bands are based on volatility. For this reason, they give better results in the short term.
Bollinger Bands alone do not give a buy-sell signal. These bands provide useful tips for us to use in our transactions. It is recommended to use these bands with auxiliary indicators. Bollinger Bands work in harmony with many indicators. But it gives more successful results especially with Volume and Momentum based indicators. Volume indicators should be our priority choice.A/D, MACD, II, MFI are a few examples of volume indicators.
After John Bollinger, the developer of Bollinger Bands, developed these bands, the first indicator that he used these bands together was the Intraday Intensity Index (II).
Again, another indicator that is frequently preferred along with Bollinger Bands is the %B indicator. The %B indicator is used to better identify divergences.
The BTCUSDT chart below shows the positive divergence. What we were specifically looking for here was the "W bottom patten". In this pattern, while the prices of the two bottom points are almost the same, an increase is seen in the %B indicator. This is positive divergence and indicates a price increase. We see that the price increases in the continuation of the price movement.
6.) Conclusions
In this lesson, we have covered two of the most basic issues that we need to know well when trading. We learned what are the differences between technical and fundamental analysis. In the simplest definition, technical analysis is the transformation of price movements into graphics through mathematical equations and the interpretation of these graphics. Fundamental analysis is the in-depth study of a cryptocurrency. Information such as the project team, the scope of the project, the number of investors investing in the project are discussed.
This course covers important topics that anyone trading should know. Thank you dear professor @imagen for this very instructive and useful lesson.
Best regards, Özge
Gracias por participar en la Cuarta Temporada de la Steemit Crypto Academy.
Felicitaciones!
Continua esforzandote, espero seguir corrigiendo tus asignaciones.