"[Trading Using Wedge Pattern] - Crypto Academy / S5W5 - Homework Post for @sachin08".

Hello steemains,
Welcome to the season 5 week 5 of the steemit cryptoacademy lectures. Professor @sachin08 taught about how we can be able to trade using wedge pattern, which i was able to understand.
EXPLAIN WEDGE PATTERN IN YOUR OWN WORD
Wedge pattern are technical analysis that is been made or perform by trader so that they can be able to fortell the future price of a particular asset in a given timeframe. On the other hand, when traders perform this particular analysis called wedge pattern, they can know the best moment ot time to enter a trade or maybe exist market.
This is been analyzed by making use of two trendlines, that is going in an upward motion and also this trendlines is going to serve as the support and resistance level forming a wedge pattern in the chart. Then the price will be moving up and down the support anf resistance level untill a breakout occurs then there will be a trend reversal either uptrend, when ut comes to falling wedge pattern or downtrend, when it comes to rising wedge pattern.
Like i mentioned above, rising and falling wedge pattern, this are the two forms of wedge pattern traders carries out. The rising wedge pattern must have two uptrending trendlines serving as support and resistance point and the falling wedge pattern must have two downtrending trendlines serving as support and resistance level.
EXPLAIN BOTH TYPES OF WEDGE AND HOW TO IDENTIFY THEM IN DETAIL.(SCREENSHOT REQUIRED)
I will explain this two types of wedge pattern in my own and they way it will be easy to understand and also show how we can identify it in the market chart.
Rising wedge pattern is simply seen as bearish or downtrend sign. When this pattern is formed, this shows or tells traders that that the market will reverse to the opposite movement which is downtrend, after a breakout occurs, so that they can take a sell position.
HOW CAN WE IDENTITY RISIING WEDGE PATTERN.
For a trader to identify this rising wedge pattern, when you see the price moving upward, but creating higher highs and higher lows, then draw you trendlines at the top and buttom of the moving chart. This two trendlines will serve as the support and resistance level and both trendlines must be moving upward. By doing this, a rising wedge pattern will be formed and when a brrakout occurs at the support level, trader have to take a sell position. See screenhot below, this shows an example of rising wedge pattern.
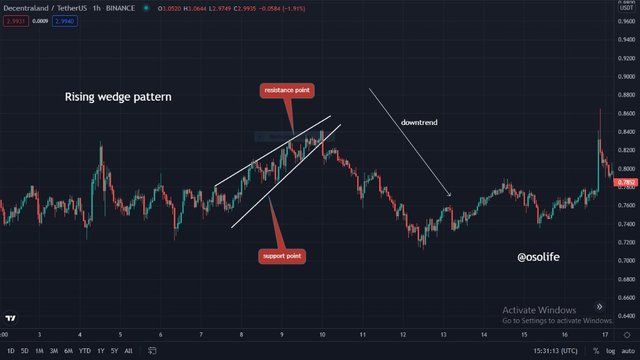
The image above, if we pay attention to it, we can see how the price was trending up hitting the support and resistance point, then till a breakout occurs at the support level, what the market did, is to reverse back to the opposite direction which is the bearish movment.
Falling wedge pattern is simply seen as bullish or uptrend sign. When this pattern is formed, this shows or tells traders that that the market will reverse to the opposite movement which is uptrend, after a breakout occurs, so that they can take a buy position.
HOW CAN WE IDENTITY FALLING WEDGE PATTERN.
For a trader to identify this falling wedge pattern, when you see the price moving downward, but creating lower highs and lower lows, then draw you trendlines at the top and buttom of the moving chart. This two trendlines will serve as the support and resistance level and both trendlines must be moving downward. By doing this, a falling wedge pattern will be formed and when a brrakout occurs at the resistance level, trader have to take a buy position. See screenhot below, this shows an example of falling wedge pattern.
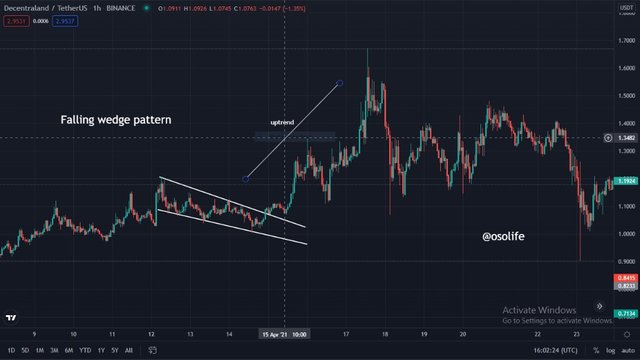
The image above, if we pay attention to it, we can see how the price was trending down hitting the support and resistance point, then till a breakout occurs at the resistance level, what the market did, is to reverse back to the opposite direction which is the bullish movment.
DO THE BREAKOUT OF THIS WEDGE PATTERN PRODUCE FALSE SIGNALS SOMETIMES? IF YES EXPLAIN HOW TO FILTER OUT THE FALSE SIGNAL.
Yea for me, i can also say that this wedge pattern can also give a false signal to traders. Lets lool at the screenshot below.
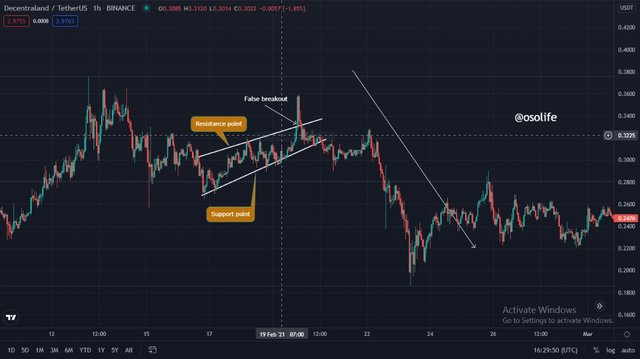
Lets pay much attention to the image above. A wedge pattern can be formed anywhere either up or down. Them meanwhile, after a breakout occurs, traders are expected to take entry depending on where the breakout occurs. Now, at this chart, we can see how the price was moving up and down hitting the support and resistance level which drew. Then there was a breakout at the resistance point, then price moved high, though it reversd back again and went down deep. So when this price breakout, some traders might have taken a buy position or buy order, bit eventually the price went down and this will cause a lot of losses.
We can also avoid this, by being very careful and also have patience with the price. Crypto market are highly volatile. So, to avoid this as a trader, as there was a breakout, all you need to do it to wait atleast let 3 green candle be formed, before taking entry. Also make use of indicators too, after performing your technical analysis.
SHOW FULL TRADE SETUP USING THIS PATTERN FOR BOTH TYPES OF WEDGES.(ENTRY POINT, TAKE PROFIT, STOP LOSS, BREAKOUT)
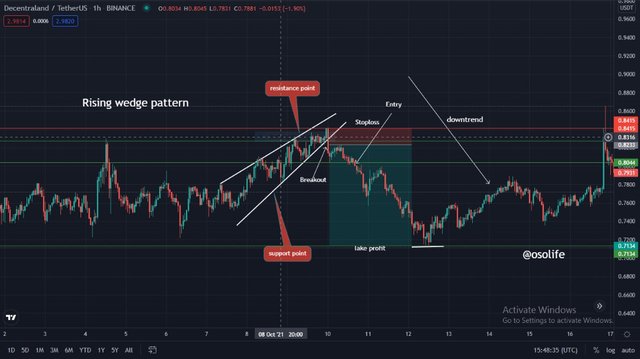
Lets pay attention to the chart i provided above, i used MANAUSDT to perform this trade. So as we can see the image above shows a rising wedge pattern, where the price was moving high, touching the support and resistance levels, untill a breakout occurs which was at 0.8316. I took my entry at 0.8044, then my stop loss was set at the top of the chart because am entering a short position, so i set it at 0.8415, which also my take profit is at the buttom of the chart which was at 0.7134, then after this, if the price goes more down to my take profit, i will be gaining.
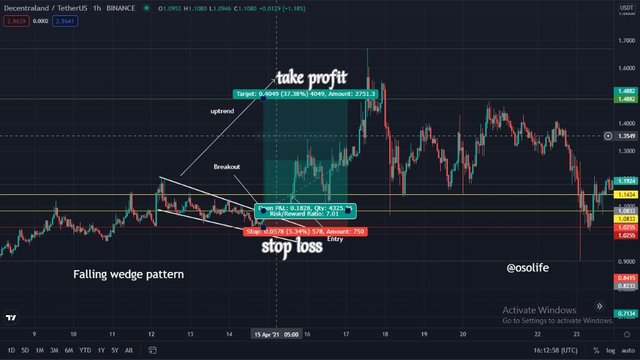
Lets pay attention to the chart i provided above, i used MANAUSDT to perform this trade. So as we can see the image above shows a falling wedge pattern, where the price was moving lower, touching the support and resistance levels, untill a breakout occurs which was at 1.0833. I took my entry at 1.1434 then my stop loss was set at the buttom of the chart because am entering a long position, so i set it at 1.0255, which also my take profit is at the top of the chart which was at 1.4882, then after this, if the price goes more high to my take profit, i will be gaining.
CONCLUSION
Wedge pattern are technical anaylsis done by traders which helps to know when the price of the market will be in bearish or bullish trend so ss to make a good entry and exit point in a given period. All thank to professor @sachin08 for a nice lecture.
Special regards
Professor @sachin08
Written by
@osolife