"[Trading Using Rectangle Pattern] - Crypto Academy / S5W4 - Homework Post for @sachin08".

Greeting steemians!
You all are welcome to the season 5 week 4 of the steit cryptoacademy. This new week came up with another new interesting topic, the levture professor @sachin08 provide was well explained in a simple word and i was able grab some insight from it. Now, am here with my homework post for professor @sachin08 about Trading using rectangle pattern
EXPLAIN RECTANGLE PATTERN IN YOUR OWN WORD.
I can say that rectangle pattern are also technical analysis done by most traders in other to foretell the future movement of the market price in the chart. The rectangle pattern i can say, contains of two horizontal trendline, whereby one is located at the top of the ranging movement of the chart and then the other located at the downside of the ranging movement of the chart, both performing the role of support and resistance level or point.
The rectangle pattern, can be drawn when the price or chart is moving equally or 50:50 between buyers and seller a given period. When we see chart like this, that is when we can draw the rectangle pattern. This can be in two types which are, it can be located or seen at the top of the chart and it can be located or seen at the downside of the chart. This makes or alert traders to know where to place order and also tell time what trend the market will trend in future.
When price is forming a range market and also is where we can draw our trendline formimg rectangle pattern, there is always a breakout of the support or resistance level. We should know that when the breakout occurs in the resistance point, we should take a buy position and when the price breakout the support level or point, we should take a sell position. Though it is not 100% sure, market can move or oppose our decision. But , i always wait, for 3 green candles to form before taking my buy position and on the other hand, wait for 3 red candles to form before taking my sell position.
We can see that the rectangle pattern are the best or might be one of the best traders make use of while trading with breakouts due to the fact that, price usually moves equally among buyers and sellers tilll when a breakout occurs, there a particular trend will occur, either bullish or bearish.
HOW TO IDENTIFY RECTANGLES. EXPLAIN WITH SCREENSHOTS.
Well, to identify rectangle pattern is not so easy like that, but i will explain how ome can be able to identify rectangle patterns. Now, rectangle pattern are found at both top of the price chat and also at the buttom of the price chart. To identify the rectangle pattern, there must be a ranging market involve, when i say ranging market, this is when both buyers and seller are equally controlling the market i.e when the market is trendline sideways without making any trend like bullish or bearish trend.
So when you see trends like that, you can draw your support and resistance line, the price must be touching both resistance line and support line, moving up and down equally without crossing any of the line (support and resistance line), untill a breakout occurs and trends down or up. If it trends up, this tell that the buyer are in full control of the market price, then if ut trends down, this tells that sellers are in full control of the market price. Remember, rectangle pattern can be found above or below the chart. Lets see chart i provided below.
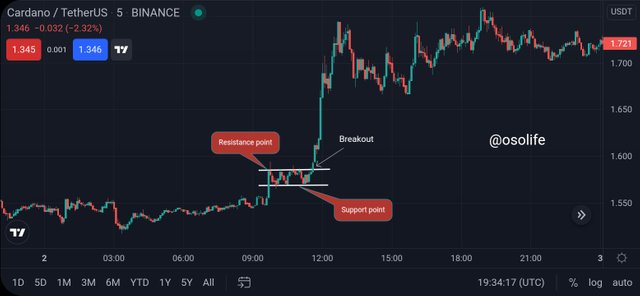
As we can see, the chart i provided above, there was a small trend forming a rectangle pattern, the price was hitting the support and resistance point without making any trend until a breakout occurs and the price started trending up. This indicates that buyer are in full comtrol of the market.
CAN WE USE INDICATORS WITH THIS PATTERN TO GET ACCURATE RESULTS? EXPLAIN WITH SCREENSHOTS.
Well, when using indicators along with the rectangle pattern could be cool and that will give you accurate result on how the market will move or the next trend on the market price. The chart below shows the technical analysis i did and also the trend i added in it so as to get accurate results. I used Super trend indicator. See screenshot below.
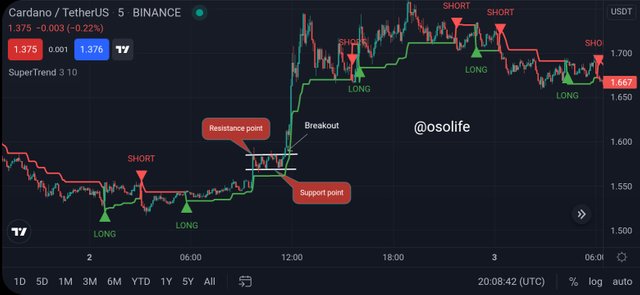
As we can see on the chart i provided above, there was a signal using the super trend indicator which show a buy signal i.e Long before i even perform my analysis. Though when this shows a buy signal, the market was moving up a little, and i didnt enter the market because i was never too sure of it, till it forms a rectangle buttom, then i performed the analysis, drawing my support and resistance level, the after then ranging trend, there was a breakout, which crosses the resistance level and the is the perfect place to take entry, as we can see how the market trends up, which shows a buy position and the means that buyer are in full control of the market.
EXPLAIN RECTANGLE TOPS AND RECTANGLE BOTTOMS IN YOUR OWN WORDS WITH SCREENSHOTS OF BOTH PATTERNS.
In this section, i will be explaining the rectangle tops and the rectangle buttom, this are two places where we can find the rectangle pattern.
RECTANGLE TOPS
The rectangle tops are always formed and located at the top of the price chart, whereby the market moves up and down between the support and resistance level or point without forming any trend. Normally, this indicates or signal that the market price arr equally controlled by both buyers and seller in a given period.
But we should know that, when the rectangle patten is formed at the top of the chart, we arr expecting the breakout to happen in the support line which will lead to bearish trend, and it signals that sellers has finally taken over the market price. Here is when to take a short position. The screenshot i below shows more explanation of what i explained about the rectangle top.
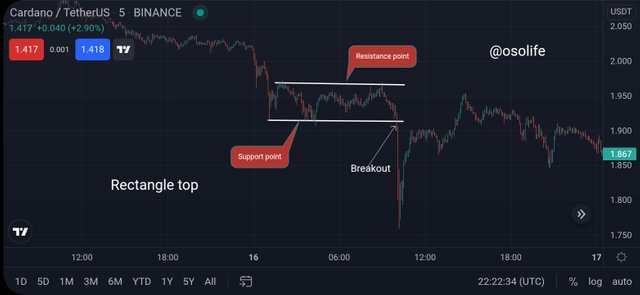
As we can see at the chart above, when the market tend to be moving up and down the support and resistance point without making any trend, till there was a breakout at the support point, which signals that the market is being controlled by sellers.
RECTANGLE BUTTOMS
The rectangle buttom are always formed and located under the price chart, whereby the market moves up and down between the support and resistance level or point without forming any trend. Normally, this indicates or signal that the market price are equally controlled by both buyers and seller in a given period.
But we should know that, when the rectangle patten is formed at the under the chart, we are expecting the breakout to happen in the resistance line which will lead to bullish trend, and it signals that buyers has finally taken over the market price. Here is when to take a long position. The screenshot i below shows more explanation of what i explained about the rectangle buttom
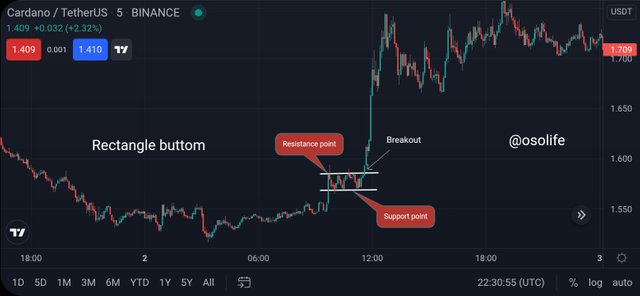
As we can see at the chart above, when the market tend to be moving up and down the support and resistance point without making any trend, till there was a breakout at the resistance point, which signals that the market is being controlled by buyers.
SHOW FULL TRADE SETUP USING THIS PATTERN FOR BOTH TRENDS. ( ENTRY POINT, TAKE PROFIT, STOP LOSS, BREAKOUT)
I will indicate full trade using in both rectangle tops and rectangle buttom, using ADAUSDT. Lets go!!
RECTANGLE TOP ( TRADE SET UP)
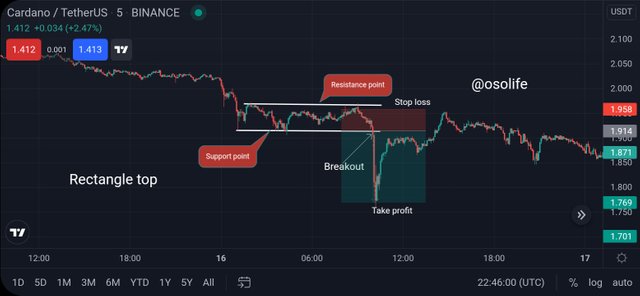
Lets focus on the chart above, am making use of ADAUSDT to perform this trade. Now the chart above, you can see when the rectangle pattern was formed above the chart, i waited patiently till there was a breakout from the support level, which i took my entry immediately at 1.914, then my take profit was set at 1.769 and my stop loss at the top of the chart at 1.958, we should have in mind that, am taking a short position after the rectangle and the breakout, now setting my stop loss above the chart and them my take profit under the chart. Once thr market trends more down and hit my take profit, the order will execute by itself.
RECTANGLE BUTTOM ( TRADE SET UP)
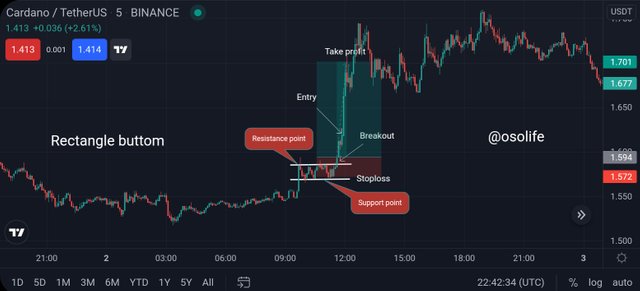
Lets also focus on the chart above, am making use of ADAUSDT to perform this trade. Now the chart above, you can see when the rectangle pattern was formed below the chart, i waited patiently till there was a breakout from the resistance level, which i took my entry at 1.600, then my take profit was set at 1.701 and my stop loss at the top of the chart at 1.572, we should have in mind that, am taking a long position after the rectangle and the breakout, now setting my stop loss below the chart and then my take profit above the chart. Once the market trends up and hit my take profit, the order will execute by itself.
CONCLUSIVELY
Trading with rectangle pattern can be very cool and can give you accurate result when trading breakouts and this is what most traders make use of and make a perfect trade. Before entering the market, making use of rectangle pattern can help you enter the market at the perfect time. All thanks to professor @sachin08 for nice lecture, i really benefitted a lot from it.
Special regards÷
Professor @sachin08