Steemit Crypto Academy Season 5 Week 1 [Beginner's Course] - Understanding Trends: @osolife

IMAGE MADE WITH CANVA
Greetings steemains, welcome to another new season of the steemit cryptoacademy season 5 week 1. The lecture by professor @reminiscence01 was well detailed. I was able to understand trends in the market chart. Below is my homework post for professor @reminiscence01.
When market is trending, it gives traders a particular information about the current trend in the market, its whether the buyers are controlling the market or sellers are controlling the market. The market price trend either upwards or downwards. In trending market,when market is trending upwards, This shows traders that buyers have control of the market, sellers can't but about to push it down. Similarly, when market is trending downwards, this shows traders that sellers have control of the market buyers can't be able to push it up.
1) a) What do you understand by a Trending market?
From my own understanding, trending market is seen as when a particular price chart moves in a particular motion, which can be uptrend and downtrend in a given period of time. Also in trending market, it can move or give the higher highs and higher lows when bullish and then lower highs and lower lows when bearishing.
We all know tha positive trends in market price which is the uptrend motion or bullish movement, this is when traders starts purchasing on a particular crypto asset. Similarly, the negative trend in the market price which is the downtrend motion on bearish movement, this is when traders are selling off their assets. Traders can know the perfect time to enter a market and the time to sell off and collect their profit by making use of technical analysis.
b) What is a bullish and a bearish trend? (screenshot required)
Bullish are bearish trend are two different movement in the market price, which gives traders information of who is controlling the market among the buyers and sellers. Now, i will explain what this movement are and how they looks like in chart.
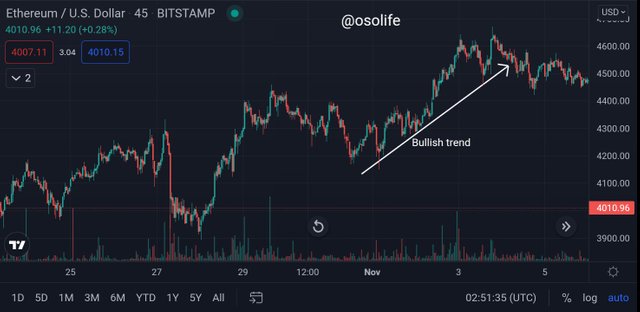
BULLISH TREND
This means positive movement i.e the positive move in the market price and this mostly where we sees the trend create a higher highs and high lows in a given time frame. When the market start bullsihing, it's mostly when traders are seriously purchasing on crypto asset and they are the ones in charge of the market price(buyers). The candlestick always charge to white or green colour, whenever the market is in bullish trend. The screenshot below is an example of bullish trend.
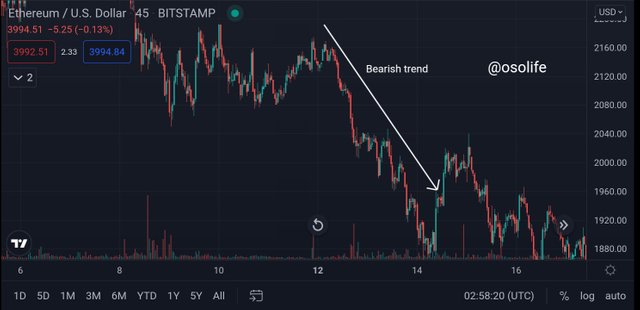
BEARISH TREND
This means negative movement i.e the negative movement in the market price and this is mostly where we see the trend creates a lower highs and lower lows in a give ln timeframe. When traders are seriously selling of their crypto assets and they are the ones in charge of the market price(sellers). The candlestick always change to black or red colour whenever the market is in bearish trend. The screenshot below is an example of bearish trend.
2) Explain the following trend identification and give an example of each of them. (Original screenshot needed from your chart). Do this for a bullish and a bearish trend.
i) Market Structure.
ii) Trendlines**
As a trader, we normally analyze crypto asset to know the time to enter the market. You may be asking yourself some various questions like, what is the perfect time to purchase or sell asset or maybe shoulf you just ignore the market?.
Now, using market structure, this can answer your questions, knowing the perfect time you should purchase on a crypto asset or the perfect time you should sell your asset just by analyzing the market using market structure. Also can help traders to know the current state or condition of the market.
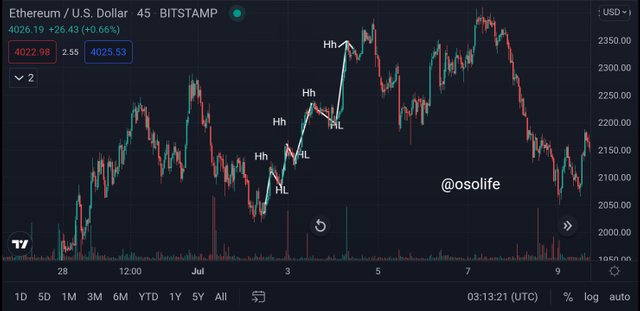
MARKET STRUCTURE (BULLISH TREND)
The normal or buy opportunities in using market structure is bullish trend. Which creates the motion of higher highs and higher lows. The is to say that, when the market price is bullishing or moving upwards, then creating a new higher highs , the comes down again but will not be lower than the last high lows that was created earlier. Then it will go up again, which will be more higher than the last higher highs that was created earlier. Below is an example of what i just illustrate.
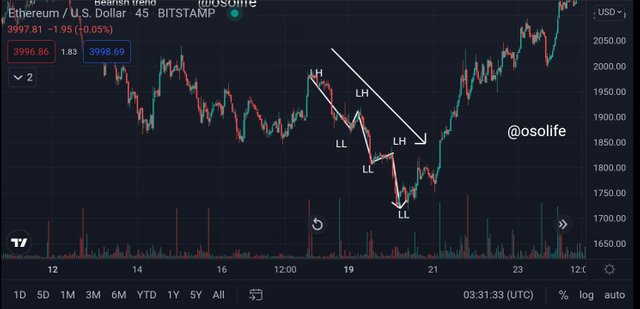
MARKET STRUCTURE (BEARISHTREND)
The normal sell opportunities using market structure us bearish trend which creates the motion of lower highs and lower lows. This is to say that, when the market is bearishing or moving downwards, creating lower lows then goes up again but will not be higher than last low highs that was created earlier. Then it will come down again which will be more lower than the last lower lows that was created earlier. Below is an example of what i just illustrated.
Trendlines is a technical tool that is used in tradingview by traders, which they make use of it to analyze or study market price motion. This trendline can simply be drawn using two low level in a bullish trend and also two high levels as well in a bearish trend.
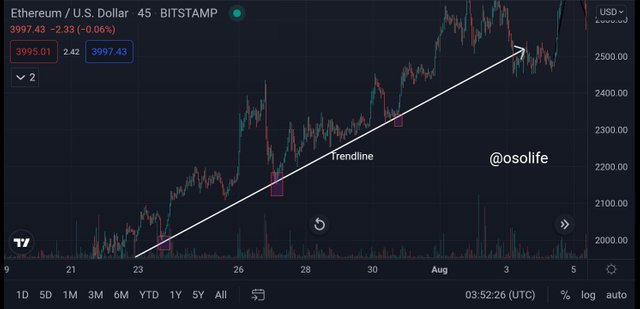
TRENDLINE (BULLISH TREND)
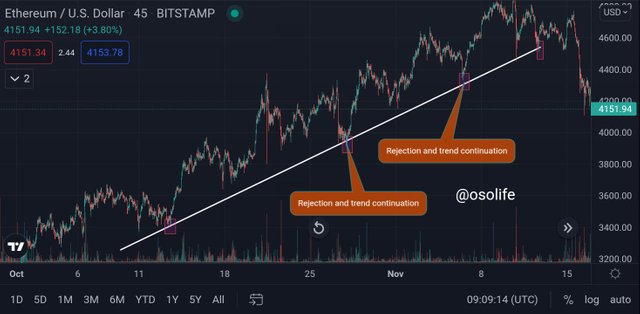
Now lets look at the chart below, as we can see on the chart, where my trendline is been drawn. I drew it below the price chart where it serves as a dynamic support. When the price trends up and eventually come down and touches the trendline, it will bounce or go up. This is how it continues untill there is a break out.
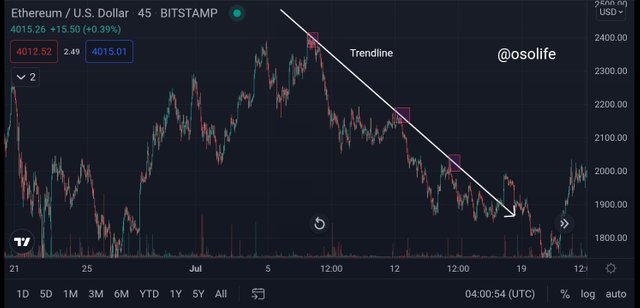
TRENDLINE (BEARISH)
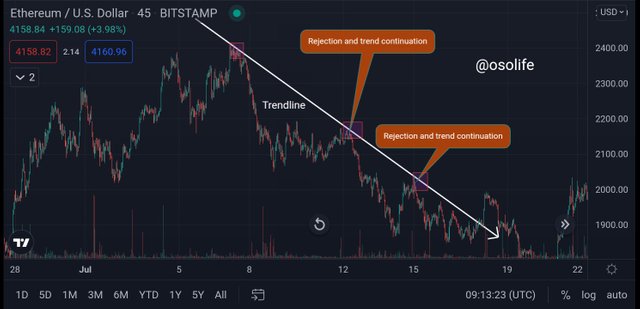
Now, lets also look at the chart below, as we can see on the chart where my trendline have been drawn. I drew it above or on top of the price chart where it serve as dynamic resistance. When the price trends down and eventually goes up and touches the trendline, it will bounce or come down down again. This is how it continues untill there is a breakout.
3) Explain trend continuation and how to spot them using market structure and trendlines. (Screenshot needed). Do this for both bullish and bearish trends.
Well, trend continuation is simply described as the retracement of price pattern i.e when a particular price repeats it's trend pattern continuously, its either going uptrend or downtrend.
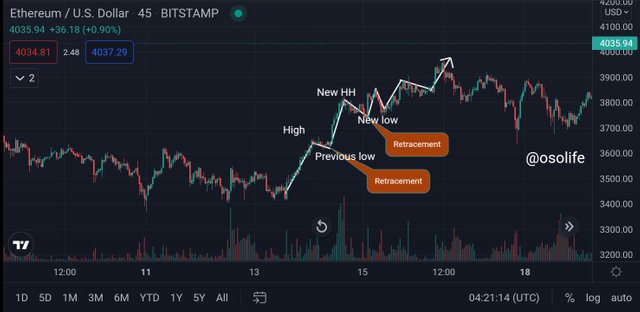
TREND CONTINUATION (MARKET STRUCTURE) CONSIDERING BULLISH TREND
Trend continuation in bullish trend always tell traders that buyers are strongly controlling the market price. In this type of trend, we always see the new that the new low formed must not get lower than the first low point. Then, the new high formed must be more higher than that of the first high. See screenshot below.
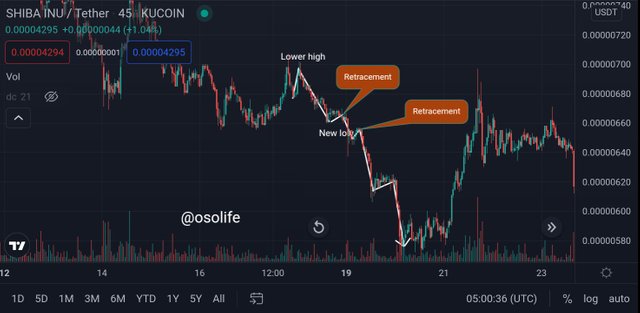
TREND CONTINUATION (MARKET STRUCTURE) CONSIDERING BEARISH TREND
Trend continuation in bearish trends always tell traders that sellers are strongly controlling the market price. In this type of trend, we always see that the new high formed must not be higher more than the first high point. Then the new low formed must be more lower than that of the first low point. See screenshot below.
TREND CONTINUATION(TRENDLINE) CONSIDERING BULLISH TREND
This is being drawn under the price chart which performs as a dynamic support. The screenshot below show how it looks like in chart.
As we can see the chart above where the price trend up and want to come down, then has retracement once it hits the trendline i.e it bounce up again.
TREND CONTINUATION(TRENDLINE) CONSIDERING BEARISH TREND
This is being drawn above the price chart which performs as a dynamic resistance. The screenshot below show how it looks like in chart.
As we can see the chart above where the price trend down and want to go up, then has retracement once it hits the trendline i.e it pull back downwards again.
4) Pick up any crypto-asset chart and answer the following questions -
i) Is the market trending?
ii) What is the current market trend? (Use the chart to back up your answers)
The chart i provided above shows SHIBUSDT chart. As we can see on the chart, the current trend is bearish trend, seller are controlling the market. The market start bullishing at first till it hits the first point of trendline i drew, then started bearishing again. It keeps going up and buyers are still struggling, though sellers are strongly controlling the price.
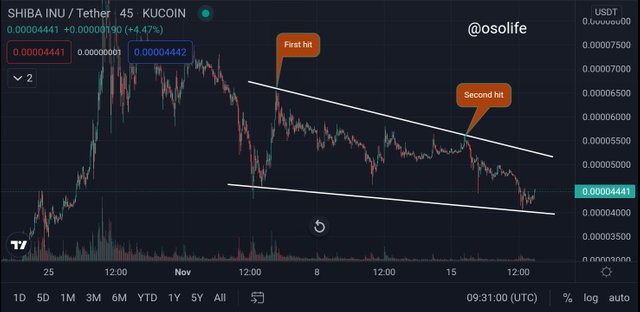
The price trends down and hits the support level at 0.0004000, then started bullishing. As we can see that, currently there was a sign of bullsigh trend. A green candlestick has shown. So trader has hope that the market might rise. The current price as of when am doing this homework is 0.00004432
CONCLUSION
Market trends gives traders a specific statistics about the current trend withinside the market, its whether the buyers are controlling the market or sellers are controlling the market. The lecture about understanding trends was well detailed, professor @reminiscence01 nailed it. Thanks for going through my post.
Hello @osolife, I’m glad you participated in the 1st week Season 5 of the Beginner’s class at the Steemit Crypto Academy. Your grades in this task are as follows:
Recommendation / Feedback:
Thank you for submitting your homework task.
Hello professor @reminiscence01
Please is 5 days now and my post has not been curated.
Please help me out
Hello professor @reminiscence01