[Recognizing Simple Patterns in Trading] - Crypto Academy / S5W2- Homework Post for @sachin08".
Hey guys!!
Welcome to another wonderful week for the season 5 of the Steemit cryptoacademy. In trading, traders have strategies they mostly use to predict the market movement. Triangles in trading is one of the strategy in trading cryptos, which professor @sachin08 explained in the lecture.
Continue reading
WHAT IS YOUR UNDERSTANDING ABOUT TRIANGLES IN TRADING. EXPLAIN ALL FORMS OF TRIANGLES IN YOUR OWN WORDS. (SCREENSHOT REQUIRED)
Well, Triangles in Trading are strategy traders always make use of to tell what the market will be in future, or predict the movement of market. With this triangles, one can be able to make a good trading decision, knowing when to enter the market and when to leave the market. This triangle are mostly drawn using two trendlines. Traders drew this lines like this÷
When predicting a buy order or predicting that the market will go high. The line that is on top of the chart are always straight, which is the resistance point. Then the line that is below the chart are always moving upward which is the support point and by doing that, it will join together with the resistance line and there a trianlgle will be formed. Once the price breakout and pass the resistance point, traders normally take there entry at that moment, because they have hope that the market will bullish.
Similarly, when predicting a sell order or predicting that the market will fall. The line that is on top of the chart are always going downwards which is the resistance point. Then the line that is below the chart are always straignt which is the support point, and by joining them together it forms a triangle. Once the price breakout and cross the support point, trader normally short the market and make there entry at that moment, because they have hope that the market will bearish (for futures traders).
NOW LETS DIVE IN TO THE FORMS OF TRIANGLES IN TRADING
Well, triangles in trading are classified in three different forms which i will list and explain below.
Lets look into the first form of triangle. Which is.
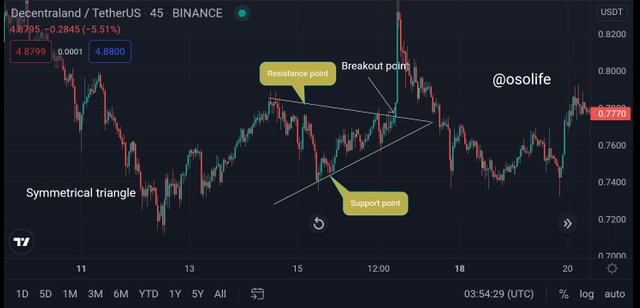
SYMMETRICAL TRIANGLE÷
Making use of symmetrical triangle, one can predict the next trend that will occur in the market chart either bullish or bearish and this mostly used by futures traders. In symmetrical triangle usually contains two trend, the one that is going in a downward motion that is at the top of the chart which is the resistance point and the other line that is moving in an upward motion that is below the chart which is the support point. So, if a breakout occur and goes either uptrend or downtrend, a trader will know what entry to take. For exmaple assuming a breakout occurs and start trending up, that is when traders normally buy. But if a breakout occurs and start treding down, that when traders normally sell, although futures trading normally short the market at that moment.
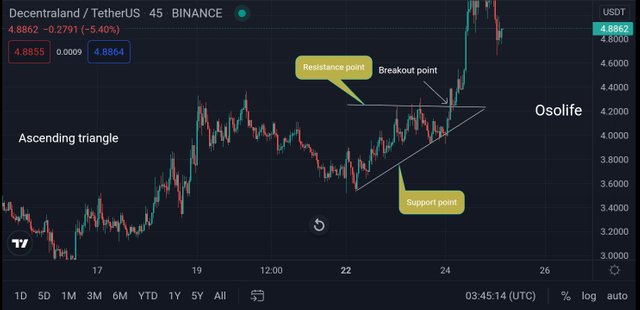
ASCENDING TRIANGLE÷
Making use of ascending triangle, one can predict the next trend that will occur in the market chart, which is mostly used by trader to predict a bullish market. In Ascending triangle usually contains two trend, the one that is in straight line that is at the top of the chart which is the resistance point and the other line that is moving in an upward motion that is below the chart which is the support point. So, if a breakout occur and goes up, a trader have to take entry i.e they place their buy order, because it tells them that the market will bullish.
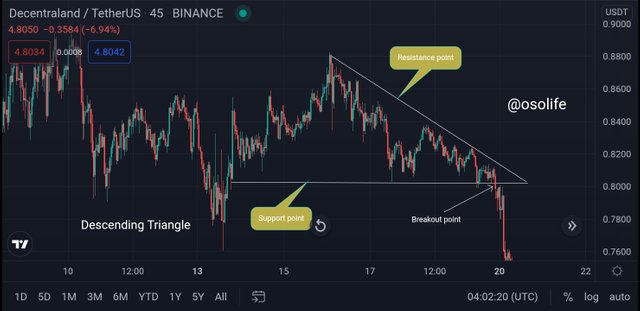
DESCENDING TRIANGLE÷
Making use of descending triangle, one can predict the next trend that will occur in the market chart, which is mostly used by trader to predict a bearish market. In descending triangle usually contains two trend, the one that is in downward motion that is at the top of the chart which is the resistance point and the other line that is in a straight line that is below the chart which is the support point. So, if a breakout occur and goes Down, a trader have to take entry i.e they place their sell order, because it tells them that the market will bearish.
CAN WE ALSO USE SOME INDICATORS ALONG WITH IT TRIANGLE PATTERNS? EXPLAIN WITH SCREENSHOTS
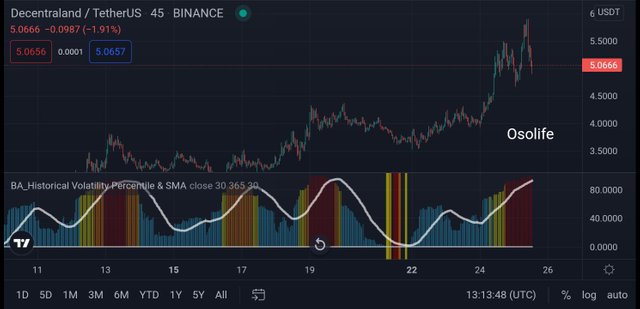
This is a powerful indicator, that shows traders where relatively the volatility is of the market at any given time. When it's super red up in hundred level i.e the hundred marker, you know there will be a high volatility in the market abd when it basically comes back down to lower like we know 1 to 10 to 20 and as obviously as the market average line as well, thats actually indicating that there's a low volatility. This indicator doesn't give you a direction of the market, buy we know that market trade like energy flowing in and out. This indicator gives you an inkling to know when there is going to be a breakout.
EXPLAIN FLAGS IN TRADING IN YOUR OWN WORDS AND PROVIDE SCREENSHOTS OF BOTH BULL FLAG AND BEAR FLAG.
In trading, flags pattern are also technical analysis a trader considers before making entry in the market price to avoid making a bad decision. The flag pattern can also be used in features tradijg to predict the next move the market price. We normally have 3 different trendline drawn when using flag pattern, this lines are- the straight line which goes uptrend or downtrend, and then the other two which serve as support and resistance level. Now, when considered all this lines, and draw them in a perfect way, it going to form a flag pattern.
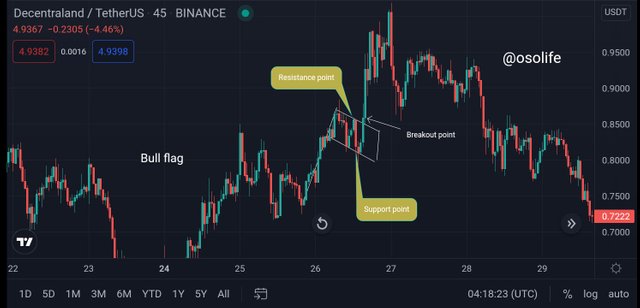
Lets consider how the bullish flag pattern looks like. Now, the a trendline that is drawn upwards following the bullish market, and above it, forms a support and resistance level, look like a ranging market, and when there is breakout in the resistance level, it shows that there will be a bullish market move.
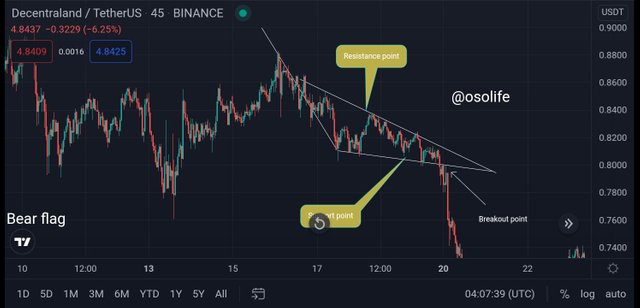
Lets consider how the bearish flag pattern looks like. Now, the a trendline that is drawn downward following the bearish market, and below it, forms a support and resistance level, look like a ranging market, and when there is breakout in the support level, it shows that there will be a bearish market move.
SHOW A FULL TRADE SETUP USING THESE PATTERNS ON ANY CRYPTOCURRENCY CHART. (ASCENDING TRIANGLE, SYMMETRICAL TRIANGLE, BEAR FLAG)
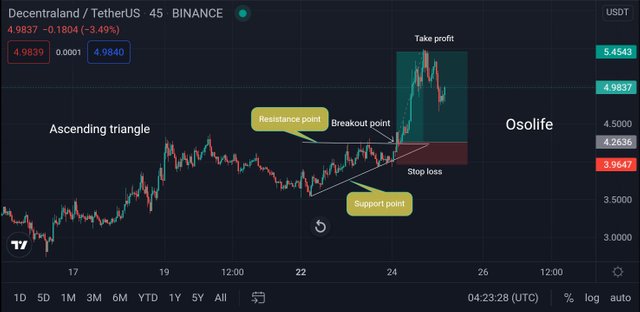
As we can see on the chart below, i made a trade using the ascending triangle. I already set my support and resistance level, which forms a triangle and with it, i can be able to make a good entry in the market. I noticed there was a breakout in the resistance level, this shows that the market will bullish, so i took my entry at 4.2636 after the breakout occurs. I set my take profit around 5.4543 and then set my stop loss around 3.9647. So incase the market falls, it will execute once it reaches my stop loss.
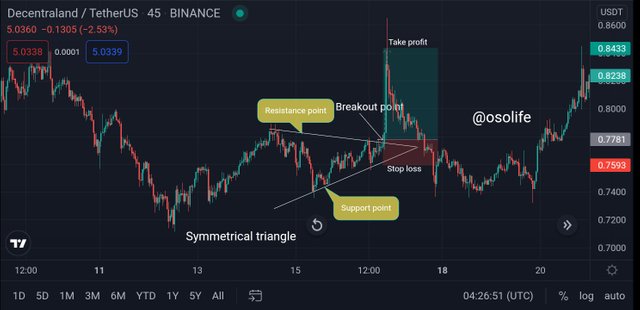
As we can see on the chart below, i made a trade using the symmetrical triangle. I already set my support and resistance level, which forms a triangle and with it, i can be able to make a good entry in the market. I also noticed there was a breakout in the resistance level, this shows that the market will bullish, so i took my entry at 0.7781 after the breakout occurs. I set my take profit around 0.8433 and then set my stop loss around 0m7539. So incase the market falls, it will execute once it reaches my stop loss.
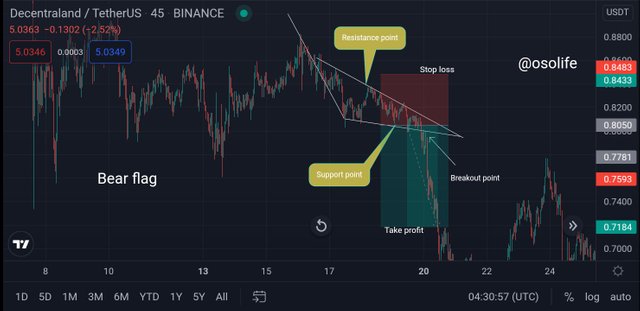
Now, using bear flag to analysis the market, i will love to use futures trade to explain. Like in spot trade, once the market it's bearishing, this is usually when sellers always sell their asset. But in futures trading, you can short the market i.e predicting the market to bearish and if it does, you make your profit. So the chat i provided is a bear flag, i used it to short the market. I have my support and resistance set already when the market price is forming a ranging market. The market started bearish at first, but not that strong, now i was able to draw my flag pattern, waiting for the price to breakout and i will take my entry. So as we can see on the chart, i took my entry around 0.8050 after a breakout occurs, then i set my stop loss at above the chart around 0.8483 and then my take profit below the chart around 0.7184.
IN CONCLUSION
A trader can make good entry and existing point if he use a good strategy like triangle in trading which professor @sachin08 explained in the lecture. I was able to learn a lot from it.
Special regards-
Professor @sachin08