" [Confluence Trading.] - Crypto Academy / S5W6- Homework Post for @reminiscence01".


Hello steemians!!
Am glad being part of this new week of the steemit cryptoacademy season 5. Professor @reminiscence01 has taught us about confluence trading which is very important when trading on cryptocurrency.
QUESTION 1. EXPLAIN CONFLUENCE TRADING. EXPLAIN HOW A TRADE SETUP CAN BE ENHANCED USING CONFLUENCE TRADING.
Trading with confluence is one of the major things while performing a trade or analysis. Traders are adviced to trade with confluence trading to be able to make a better decison in the market. Now, confluence trading simply means, adding different tool or indicators on the market chart in order to get a better signal, than depending on a particular indicator or trading tools.
As a trader, you can't rely on a single strategy before making a trading decision or entering the market, because we all should understand that, this indicators are not 100% sure or accurate, even some technical analysis we do carry out sometimes fails us by opposing our decision in the market.
That is why it's very important to trade with confluence by adding different trading tools or indicators in order to get a better result.
Again, cryptocurrencies are highly volatile, sometimes it goes against our decision. So i can say that, trading with confluence helps traders to be able to manage risk in the market and also be able to get a better result on a specific trend.
EXPLAIN HOW A TRADE SETUP CAN BE ENHANCED USING CONFLUENCE TRADING.
Using the chart below, I will explain how a trade setup can be enhanced making use of confluence trading. Like i explained, a trader suppose not to rely or depend on a single strategy or tool before making a decision to enter the market.
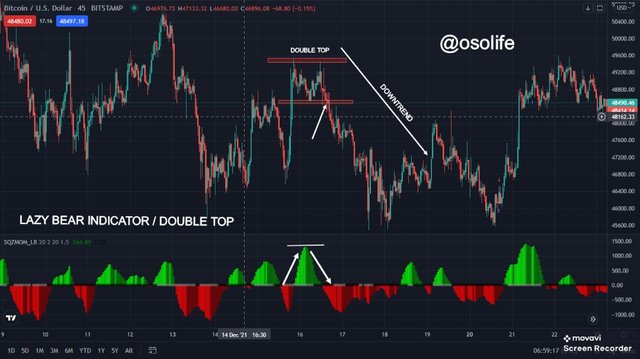
When look at the chart above, i used different strategies to figure out the trend of the market. I performed technical analysis using double top and also used squeeze momentum indicator known as lazy bear. Now, the double top signals a bearish trend. It is usually used to identify trend reversal, when you see a double top on the chart, you have to get ready to short the market after a breakout. As we can see on the chart above, there was a breakout at the area i pointed the arrow, then the market starts trending down. Now, not being very sure about the trend, i have to add indicator to it so that i can to get accurate result.
I then added the lazy bear indicator to it. Using this indicator, it have a green colour mountain and a red colour Mountain. If we look very well, we can see that it has light green colour and dark green colour, same as the red. Now, when you see the light green colour, it signals a bullish trend and when the dark green colour appears, it tells that the market is about to reverse to bearish trend. Then it will enter the red colour, which shows a bearish trend, then when it enters the dark red colour it signals that the market is about to reverse to bullish.
Now, from the chart above, after the double top was formed, we can see that a dark green colour appear, which signals to be that the market is about to bearish and this is the best time to enter a short position.
QUESTION 2. EXPLAIN THE IMPORTANCE OF CONFLUENCE TRADING IN THE CRYPTO MARKET?
Is very important to trade with confluence trading in ther market. It will help you avoid so many things in the cryto market. There are many things it helps a trader to do which i will list below.
When we trade with confluence, it helps traders to experience low losses and make maximum gain in the market.
cryptocurrency are highly volatile and sometimes goes against ones decision which can be that a trader loss his money. But with confluence trading, a trader can be able to find out false signal, due to the different strategies the trader used.
A trader can be able to acquire more knowledge in trading skills and this will make a trader to master the market trend when trading with confluence.
It provides accurate results than when using only one strategy to perform a trade and with confluence trading, a trader can make a great setup in trading.
QUESTION 3. EXPLAIN 2-LEVEL AND 3-LEVEL CONFIRMATION CONFLUENCE TRADING USING ANY CRYPTO CHART
There are 2 or 3 level confirmation confluence trading which traders carries out in order to get accurate result when trading on a particular asset. I will explain below what 2 and 3 level confirmation confluence trading means and how one can apply it on a chart before making a decision to buy or sell.
Applying 2 level confirmation confluence trading, is when you as trader makes use of at least 2 strategies or trading tools to get a better information before entering a buy or sell position in the market and not relying on one pattern. Lets see the screenshot below.
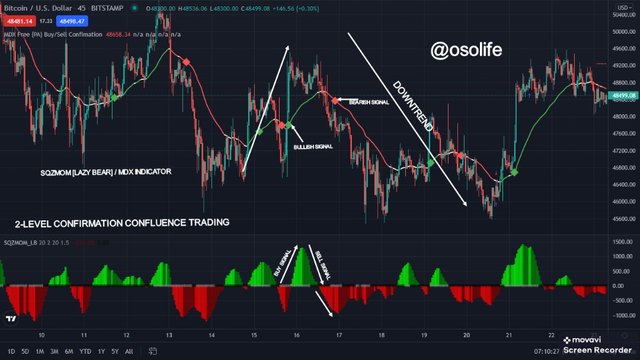
As we can see the chart above, this is considered as 2-level confirmation confluence trading using BTCUSDT chart. The chart above consist of two different indicator "Sqzmom [lazy bear] and MDX indicator". This two indicators signals a bearish movement at the area we are focusing. If you look at the chart after the double top was formed, then the market reversed back to the opposite direction which is the bearish trend. Now the MDX indicators signals a bearish movement as the red box appears. Then if we look at the lazy bear indicator, we can see that it has turned to dark green, which signals a bearish trend that is about to happen. So, we can see that the market has taking over by the sellers. So with this two indicators, a trader can be comfortable when entering a short position or buy order.
Applying 3 level confirmation confluence trading, is when you as trader makes use of at least 3 strategies or trading tools to get a better information before entering a buy or sell position in the market and not relying on one pattern. Lets see the screenshot below.
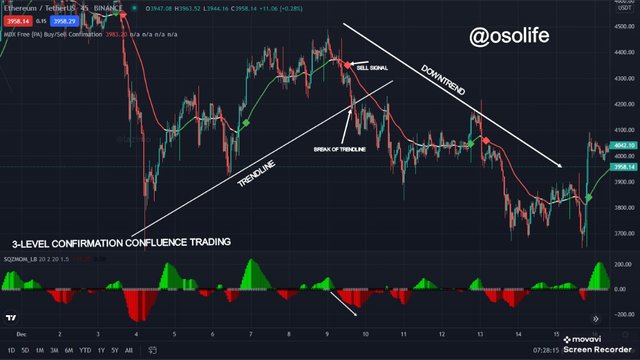
In this chart, i made use of ETHUSDT, as we can see the chart, i also applied the two indicators, but the different thing is that, i performed a technical analysis along with the two indicators which i explained above. Now this technical analysis i carried out is known as break of trendline. When we see the movement on a chart and our trendline is located at the buttom of the chart, whereby the price hits it and bounces up. Then when there is a breakout, which shows that buyers are not capable to push the price up, its signals a bearish movement, sellers are taking over the market. So with this analysis along with the two indicators, can give a trader a better result to enter a short position.
QUESTION 4. ANALYZE AND OPEN A DEMO TRADE ON TWO CRYPTO ASSET PAIRS USING CONFLUENCE TRADING. THE FOLLOWING ARE EXPECTED IN THIS QUESTION.
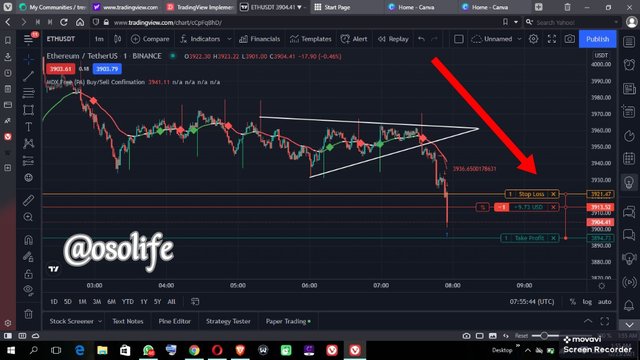
The ETHUSDT chart above, signals a downtrend movement as we can see. I made use of the 2-level confirmation confluence trading which i explained above. In this chart, i performed a technical analysis using two trendline, the one in uptrend motion and the one in downtrend motion. This analysis is known as symmetrical triangle pattern, where by it seen as when market price are equal i.e the market price is being controlled equally between buyers and sellers untill a breakout occurs at the top or down. So the chart above, there was a breakout at the support line and i didn't enter a short position immediately, but i have to wait a little and then added the MDX indicators which also gives signal of a bearish trend.
Then, i took my entry when the price was at 3913.52, on the other hand set my stoploss above the chart, because this is a short position. The stoploss was at 3921.47 which was a bit closer to my entry point. Finally, my take profit at 3894.73 which was below the entry point.
EXPLAIN THE STRATEGIES/TRADING TOOLS FOR YOUR CONFLUENCE.
Symmetrical Triangle
- Its a technical analysis carries out by traders to make a trading decison. It is also used for trading breakouts in a given period of time. This is being drawn with two trendline, one moving upward which serve as support line and the other one moving downwards, which serves as resistance line. When this are carried out, traders are expecting the breakout to occur either from the downside or upside.
MDX indicator
- This is an indicator mostly used by traders to predict the next trend of the market in other to take a buy or sell position. When there is a green block appeared on the chart, it shows a buy signal and when there is a red block, it shows a sell signal.
Both strategies signals the same thing, which is the bearish trend..
The MDX indicator signals a bearish trend when the red block appears on the chart and the market started trending down.
The symmetrical triangle, signals bearish movement, when the breakout occurred at the support level, which shows that sellers are controlling the market. This lead to a bearish movement.
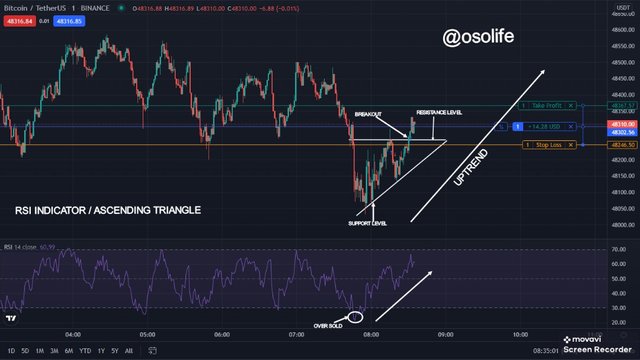
The BTCUSDT chart above, signals an uptrend movement as we can see. I made use of the 2-level confirmation confluence trading which i explained above. In this chart, i performed a technical analysis using two trendline, the one in uptrend motion and the one in horizontal movement This anaylsis is known as ascending triangle pattern, where by it seen as when market price are about to move upward after a breakout at the resistance level. So the chart above, there was a breakout at the resistance line and i didn't enter a long position immediately, but i have wait a little and then added the RSI indicator which also give signal of a bullish trend shows that the market was oversold.
Then, i took my entry when the price was at 48310.00, on the other hand set my stoploss below the chart, because this is a long position. The stoploss was at 48246.50 which was a bit closer to my entry point. Finally, my take profit at 48367.57 which was above the entry point.
EXPLAIN THE STRATEGIES/TRADING TOOLS FOR YOUR CONFLUENCE.
Ascending Triangle
- Its a technical analysis carries out by traders to make a trading decison. It is also used for trading breakout in a given period of time. This is being drawn with two trendline, one moving upward which serve as support line and the other one in horizontal movement, which serves as resistance line. When this are carried out, traders are expecting the breakout to occur at the resistance level which signal a buy order.
RSI indicator
- This is an indicator mostly used by trader to predict the next trend of the market in other to take a buy or sell position. When the market is over sold, it signals a buy order and when it's over bought, it signal a sell order.
Both strategies signals the same thing, which is the bullish trend..
The RSi indicator signals a bullish trend when the market it's being over sold, then the price tends to trend up.
The ascending triangle, signals bullish movement, when the breakout occurred at the resistance level, which shows that buyers are controlling the market. This lead to a bullsih movement.
CONCLUSION
A trader should not rely or depend on one strategy before making a trade decison, rather he or she have to make use of confluence trading to get a better signal.
NOTE÷ ALL SCREENSHOTS WAS FROM TRADINGVIEW
THANKS FOR STOPING!!!
Special regards÷
Professor @reminiscence01
Hello @osolife , I’m glad you participated in the 6th week Season 5 of the Beginner’s class at the Steemit Crypto Academy. Your grades in this task are as follows:
Observations:
This is not a good trade. The setup was clear but the entry was late and your stoploss position is not in a strategic point. I hope you can better your entries and trade management.
Thank you for participating in this homework task.