Trading Strategy with Median Indicator - Steemit Crypto Academy |S6W4| - Homework Post for Professor @abdu.navi03
Hi Professor @abdu.navi03 I am @ononiwujoel one of your students in Crypto Academy and a member of the steemit platform and this is my homework submission post from your lecture CRYPTO TRADING STRATEGY WITH MEDIAN INDICATOR

1-Explain your understanding with the median indicator.
Trading has been made easier and more profitable with the invention of technical tools which in turn has lead to the concept of technical analysis. Technical analysis involves studying an asset via the use of charts, price action, patterns, historical data and technical analysis to understand the market structure, market psychology and forecast possible price movements. There are many traders that lack the ability funds-wise to influence the market in their interest so they can only work with the established market trends to make profits and with the high volatility and constant trend changes in the market it is very advisable to utilise technical indicators while trading.
Median Indicator is a very useful and effective technical tool which focuses on trend markets (it is a trend-based indicator). This technical tool identifies market trends and calculates volatility using ATR channel and the median line.
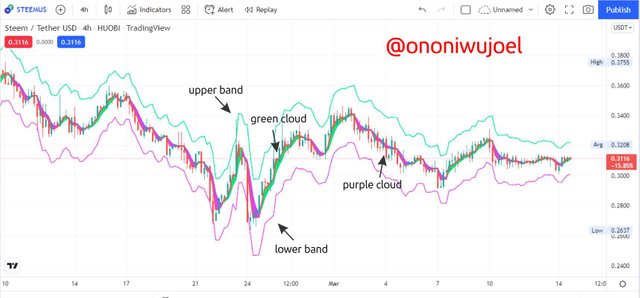
In the Median Indicator, the Average True Range is represented by two lines which runs above and below the median line displaying market volatility with respect to a given period of time. When the range between the ATR lines are far it signals high volatility and vice versa when they're closer. The value of the median line is gotten by comparing the median lines to EMA of same period, their difference is then represented on the indicator with a cloud that shows bearish with purple colour and bullish with green colour.
So whenever the median line is above the EMA of same period it displays a green cloud to show an uptrend and whenever the median line is below the EMA of same period it displays a purple cloud to show a downtrend.
Hence the Median Indicator is not just effective but also very user friendly. The colourations makes it pretty easy to identify trends and trend changes while the ATR channel helps to measure price volatility with respect to time. This helps us to know when buyers are having the upper hand in the market and when sellers are doing so.
This indicator is also very effective for trending markets not ranging markets.
2-Parameters and Calculations of Median indicator. (Screenshot required)
Parameters of Median Indicator includes median length, EMA value, ATR, ATR Multiplier, upper band and lower band.
To view these on our chart I'll use the platform tradingview and apply Median Indicator to the chart.
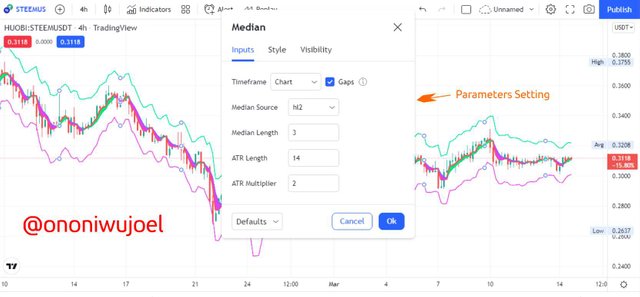
Entering the settings of the indicator we can see data like Median source, median length, ATR length and ATR Multiplier on the inputs section and their values can be changed to our preference. The style section gives options for coloration while the visibility section gives options for timeframes and they can be adjusted to the trader's preferences as well.
Median Indicator calculates the difference between the median line and EMA of same period and also the percentage change of the ATR.
Meanwhile
EMA = CP x M + Previous EMA x (1 - M)
Where
CP = closing price
M = Multiplier
Median length = number of data points used in median calculation
ATR = period used for calculating ATR of median
Upper band = Median length + (2 ATR)
Lower band = Median length - (2 ATR)
We can observe from the settings that these parameters already having default values which works just fine generally but can be adjusted if the trader has other preferences in mind.
3-Uptrend from Median indicator (screenshot required)
Identifying an uptrend from a Median Indicator is quite easy. Median Indicator generally focuses on price trends using the Median line and EMA of same period for calculation which in turn is displayed in colored clouds formation on the indicator.
In the case of an uptrend the Median is below the above the EMA of same period and thus forms a green cloud on the indicator showing that the number of buyers is greater than that of sellers in the market and there is a general positive market psychology.
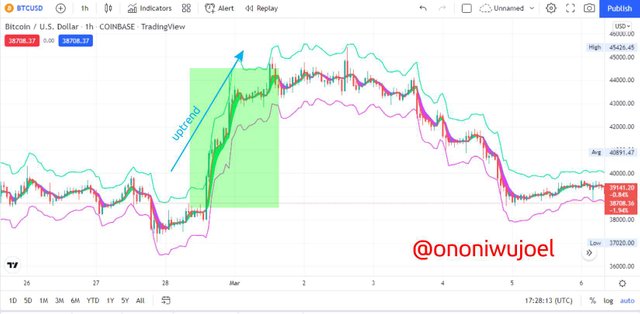
From the chart above we can observe the green coloration of the clouds formed showing that the market is on a bullish trend right from the beginning of the uptrend to the point where purple clouds takes over to end of the bullish and beginning of price decline.
4-Downtrend from Median Indicator (screenshot required)
The process for identifying a downtrend from Median indicator is very similar to that of an uptrend except that it goes the other way round. In this case the median is below EMA of same period showing that there is a general negative market psychology and the sellers are more than buyers. Purple clouds are formed in the indicator to signal the downtrend and we can even observe from the chart that there is a succession of bearish candles
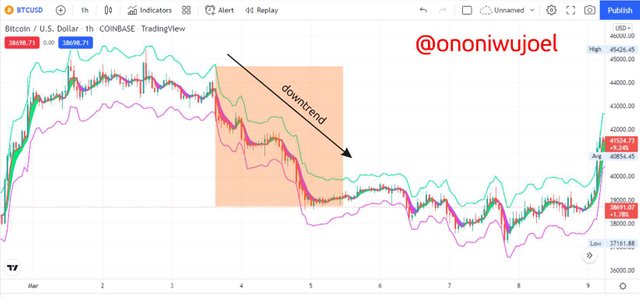
The chart above has the Median Indicator applied which shows us purple clouds formation signalling a bearish market right from the beginning of the downtrend to the point where green clouds are formed again signalling the end of the downtrend
5-Identifying fake Signals with Median indicator(screenshot required)
The problem of false signals is very common in technical analysis especially in trending markets and as a maof fact there is no indicator or strategy that is 100% efficient on its own so it is very common to receive false signals when using trend-based indicators. Most times this false signals are as a result of Whales influencing the market with voluminous trade orders to move prices in their interest while it can also be due to the fact that most indicators including Median Indicator uses previous data points in calculations which can lead to the market moving slower or faster than current prices.
So it is expected of a good trader to Median Indicator combined with another indicator that is not trend-based for confluence in order to confirm market signals and filter noise and fake signals.
A good option for this confluence establishment is the Random Index Indicator usually abbreviated to RSI indicator. This indicator is not trend-based but rather focuses more on the price volatility and signals when the asset is overbought or oversold by the price movement going above the 70 point or below the 30 point respectively. This indicator also identifies reversals and helps in forecasting possible price movements.
So we can combine the RSI indicator with Median indicator for confluence trading.
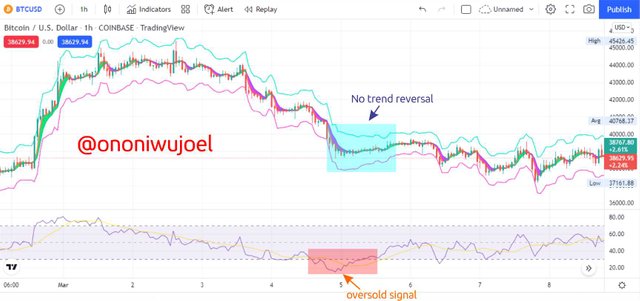
From the chart above we can see a clash of signals as the RSI shows price crossed the 30 point which means the asset is oversold and expected to show a trend reversal to bullish but there is no sign of Trend reversal on the Median Indicator as the market continues with the bearish trend. This makes the signal incomplete and shouldn't be use because its a false one. The Median indicator and RSI indicator signals must tally before it should be taken as a valid opportunity.
6-Open two demo trades, long and short, with the help of a median indicator or combination that includes a median indicator (screenshot required)
I will be using TradingView platform for demo trading in this section.
Buy Trade
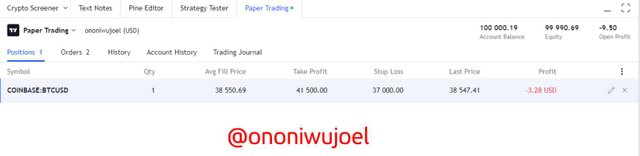
For the Buy trade I'll be trading with BTC/USD currency pair.
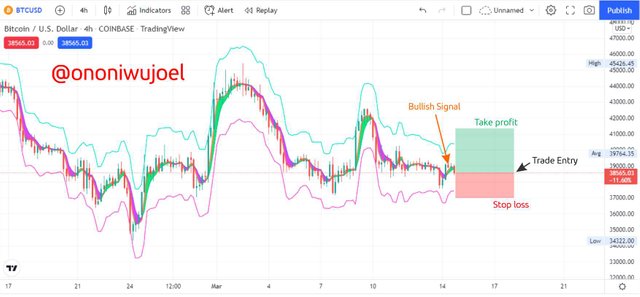
From the chart above with a 4hr time frame we can observe that the market is very active with trends after trends and just came to the end of bearish trend with green cloud forming in the indicator and a long bullish candle closed in the green cloud followed by two candles in same direction so I can say this is a bullish signal and a good opportunity for a Buy Trade entry.
So I made my trade entry with stop loss at $47,000 and take profit at $41,500 giving a Risk/Reward ratio of 1:2.
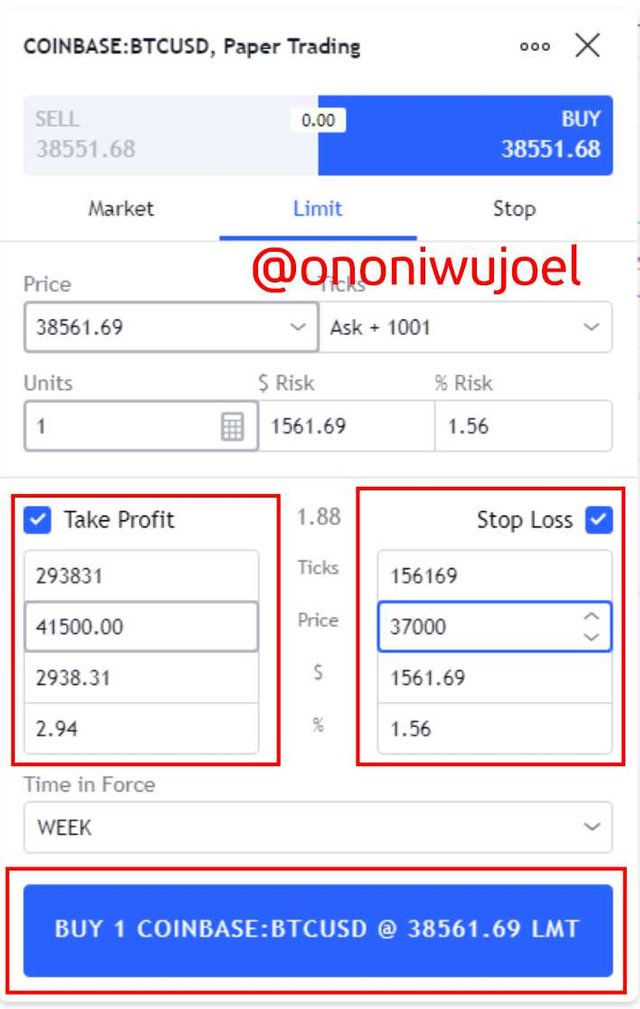
Having made my trade entry I can now wait for execution
Sell Trade
For the Sell trade I'll be using our platform's native coin STEEM and USD currency pair
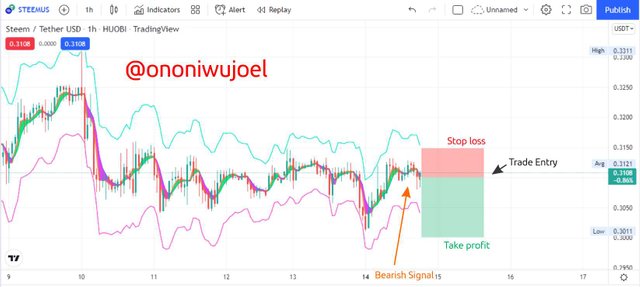
The chart above with a 1hr time frame shows that the market enjoyed a bullish trend after experiencing a ranging market for some time, but the bullish trend is over now and we already have purple clouds and bearish candles signaling the kickoff of a bearish trend.
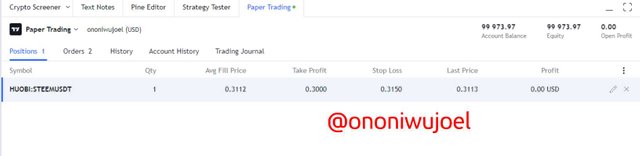
So I made my trade entry for a Sell trade with stop loss at 0.315 and Take profit at 0.300 giving a ratio of 1:2.
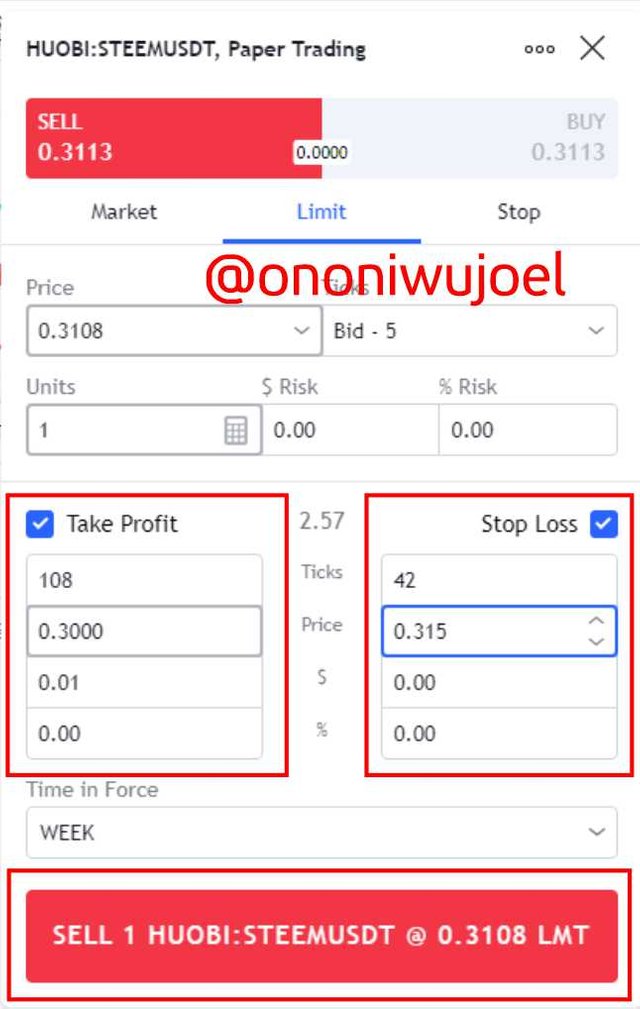
My Sell trade entry is complete now and all I have to do is wait for execution to know if its a profit or loss
Conclusion
We have been able to learn about the Median Indicator which is an advanced trend-based technical tool very effective for trending markets. This indicator also measures volatility of prices and is very useful for price forecasting. The Median indicator uses ATR and EMA alongside other parameters to achieve its calculations and is generally a potent indicator when used properly
We also saw how to identify false signals which is no new phenomenon in trading due to market volatility and other factors that influence price movements using confluence with another indicator like RSI or other non-trend based indicators.
Median Indicator uses the colors of clouds to show changes in trends and good trading opportunities.
Before now I actually didn't know this technical indicator existed, so this is a great lecture for me
Cc: Professor @abdu.navi03