[Psychology of Trends Cycle] - Crypto Academy / S6W4- Homework Post for @reminiscence01
Hi Professor @reminiscence01 I am @ononiwujoel one of your students in Crypto Academy and a member of the steemit platform and this is my homework submission post from your lecture Psychology of Trends Cycle


1. Explain your Understanding of the Dow Jones Theory. Do you think Dow Jones Theory is Important in technical analysis?
Dow Jones theory popularly known as Dow Theory is believed to be foundational to price action and modern technical analysis. This theory was written by a well known journalist and finance analyst called Charles H Dow who happen to be one of the founders of Wall Street Journal in late 19th century but was published and expanded after his demise by other analysts that followed his work.
Dow theory highlights crucial arguments that covers price action and market structures which till date has been found very effective in finance markets and has been used for the development of several strategies for technical analysis.
Dow theory proposes that a market is either on an uptrend or a downtrend and it is an uptrend when the average price is higher than the previous high and is succeded by price movement. In other words, its an uptrend when the market is having higher highs and higher lows but when the price pattern is opposite then its a downtrend.
Dow theory also highlights that there are basically three types of trends which are mostly determined by their period of effectiveness. If a trend last up to a year then it is a primary trends, if it lasts between months and weeks then its a secondary trend but if it lasts between days and hours then it's a minor trend.
According to Dow theory, trends occur in different stages. One is the Accumulation stage when buyers control the market and there more Buy trade positions, another stage is the Distribution stage when sellers control the market and major participation is Sell trade positions while the last is the stage in-between the Accumulation and Distribution stages. This stage is where the market psychology is geared towards the developing trend and Whales are making their entries while majority of smaller accounts are rushing into positions in panic caused by sentiments and market noise.
Dow theory also believes that the Volume should tally with the market structure so there should changes in trade volume when there is trend reversals and during the Accumulation/Distribution stages.
Finally I believe Dow theory is very important for technical analysis. Looking at the arguments in the theory we can see that this is the bedrock of almost all the strategies being used in technical analysis today. It explains the phenomenon of trends, market structures and how to follow price patterns without falling victim of market noise and false speculations. Moreover a knowledge of Dow theory gives traders a good background in understanding and applying technical analysis effectively.
2. In your own words, explain the psychology behind the Accumulation and Distribution phases of the market. (Screenshots required).
We already know both from the Dow theory and general knowledge that the market cannot move in one direction forever, it moves with retracements and changes direction with time because it is being influenced by supply and demand which are contrary forces working in opposite directions.
When there is a general positive market psychology the market experiences more Buy positions as traders purchase the asset thereby increasing its value and stimulating an uptrend, on the other hand when the market psychology turns negative it affects the market structure as the huge accounts start taking profits and closing their positions while smaller traders try to sell their positions in line with the trend and all of these activities stimulates a downtrend in the market.
So we can say the era of demand having the upper hand is the Accumulation phase while the period of supply having upper hand is the Distribution phase.
Accumulation Phase:
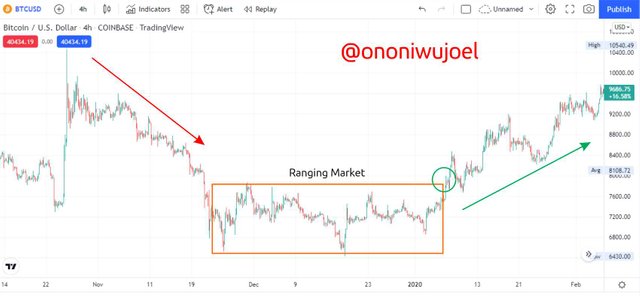
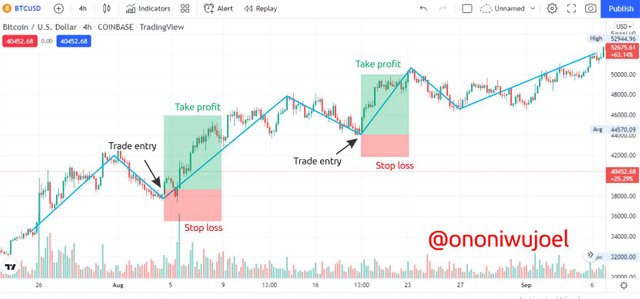
The market is said to be on Accumulation phase when there is a brief period of undecided trend before a trend reversal or trend continuation when a investors and traders are buying positions making the market move in a sideways pattern for some time before breaking into a trend reversal or trend continuation. Price movements are mainly influenced by Whales with voluminous trade orders while other smaller traders that can't influence price movement try to keep up with the trends and signals. So when these huge accounts starts Buying positions during a trend it makes the trend start ranging as the opposing forces of buyers and sellers interact until one gives way.
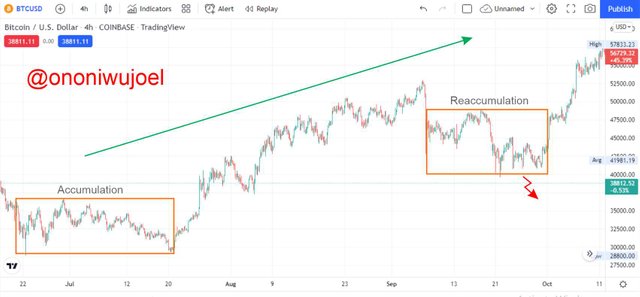
From the chart above we can observe the formation of Accumulation phase in the market after which the ranging market is broken into a trend continuation and the process is repeated in a Reaccumulation.
We can also observe the losses any trader that misinterprets this as trend reversal will suffer. The zigzag arrow shows us the proper way a trend reversal should have occurred, it should have broken the support of the price and moved downwards instead so this is a trend continuation after Reaccumulation.
Distribution Phase
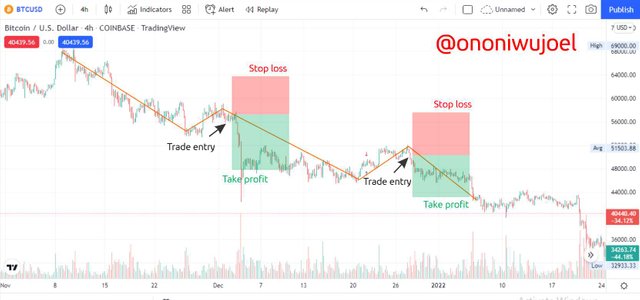
The Distribution phase is a direct opposite of the Accumulation phase. While the later highlights activities of traders Buying positions, the Distribution phase highlights the period between trends when investors and traders are Selling their positions thereby resulting in a slow ranging market after which the trend continues. At this stage huge accounts close their positions and take profits after which the market continues in a downtrend making smaller unsuspecting traders to incur losses especially when they misinterpret it for weakness of Trend which should stimulate a trend reversal
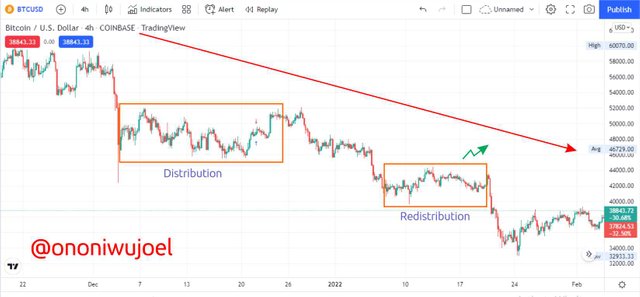
The chart above gives us an illustration of Distribution and redistribution in a bearish market. We can see the slow ranging market which is a result of interaction between buyers and sellers until it is broken into a trend continuation and the process repeats itself in a redistribution. The zigzag arrow also illustrated what a trend reversal should look like at that point, it should break the resistance and continue in an uptrend hence this is not a trend reversal.
3. Explain the 3 phases of the market and how they can be identified on the chart.
There are three phases of the market in finance trading which are: Bullish phase, Bearish phase and Ranging phase. I'll be explaining these phases one after the other below.
Bullish Phase
A market is said to be on a bullish phase when the price movement is experiencing higher highs and higher lows showing that the buyers are in control of the market hence the buy positions are greater than sell positions making the price to move in an uptrend.
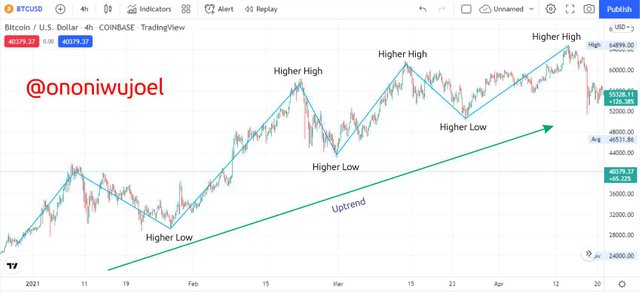
From chart above we can see that the market is on a bullish trend and we can also observe that the price is moving with retracements which forms the higher lows, this is because traders are taking profits after each higher highs hence allowing the price to cool off and gather momentum for another surge until the bullish trend is finally exhausted
Bearish Phase
A bearish market is a direct opposite of a bullish market. In the bearish phase we experience lower highs and lower lows showing that the interaction between buyers and sellers in the market is now controlled by sellers and there are more Sell positions in the market hence the price keeps moving in a downtrend
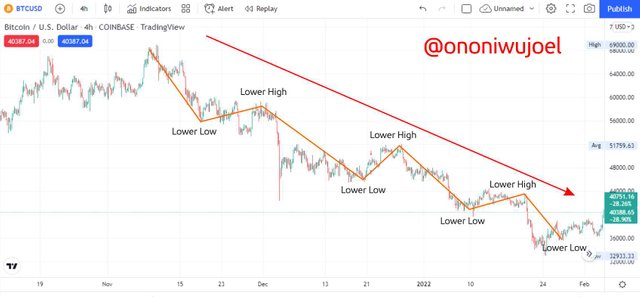
The chart above gives us an illustration of a market going through a bearish phase. We can observe the price moving downwards with pullbacks as traders keep taking the profits and allowing the price to gather momentum for further falls. Trading in a bearish trend requires the trader to be able to take advantage of the pullbacks and make entry at the lower highs.
And it is important that a trader don't mistake retracement for trend reversal.
Ranging Phase
This phase is also referred to as Sideways market and is riskier than its counterparts. As a matter of fact many traders don't trade in ranging market because its unpredictable and risky.
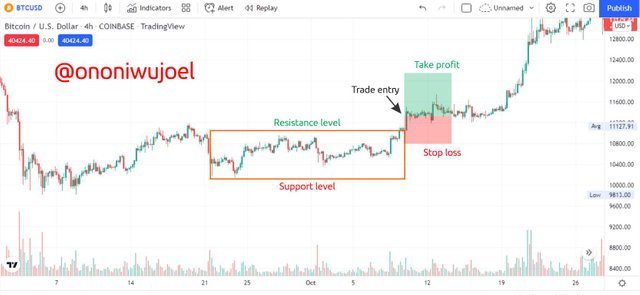
A market is said to be on a Ranging phase when the price is neither on an uptrend nor a downtrend but just moving sideways between a support and resistance level. This shows that the interaction between buyers and sellers in the market is close to a stalemate hence no one is having a upper hand between supply and demand.
This phase usually occurs when a trending market is exhausted and the price movement slows down to gather strength for either a trend reversal or trend continuation
The chart above gives an illustration of a Ranging phase in a trending market before a trend reversal took over but there also scenarios where a trend continuation takes over as well.
We can also observe that this is the market phase where Accumulation and Distribution stages usually occur.
4. Explain the importance of the Volume indicator. How does volume confirm a trend? Do this for the 3 phases of the market (Screenshots required).
Just like the name implies the volume indicator displays the volume of trade activities within a period of time in the market. It is usual for market volatility to increase during a bullish or bearish trend and when there is a Breakout from a ranging market because several traders are making trade entries at this times.
The volume indicator is represented by straight bars which are either green or red, the greenish bars represent bullish while the red bars represent bearish. These bars use their length to show increase or decrease in trade volumes and market volatility.
Bullish trend
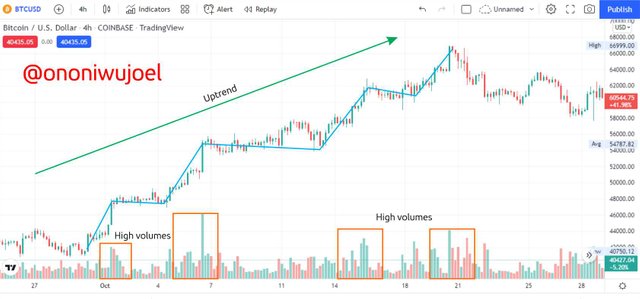
The chart above gives an illustration of how the volume indicator displays trade volumes and market volatility in a bullish market. We can observe how the volume indicator displays longer bars that are equivalent to the strength of the uptrend whenever the price moves in an uptrend and also displays smaller bars when the price retraces before going for a higher high.
Bearish trend
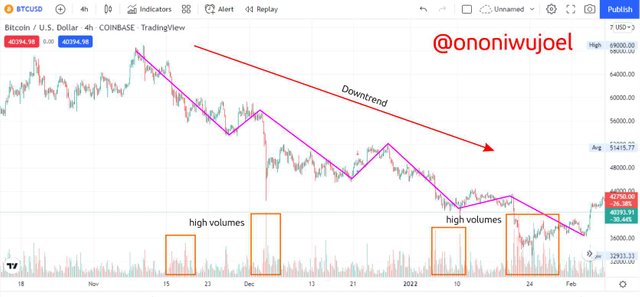
We can also observe the volume indicator displaying longer bars when there is a strong downtrend movement showing that trade increased strongly at these stages and shorter bars when the price pulls back as traders take their profits before another bearish movement is made. The volume indicator thereby confirms trend movement as well as provide information on the rate at which trade entries are being made in the market with respect to time.
Ranging Market
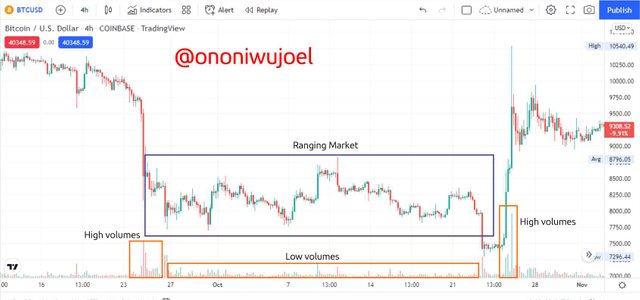
Volume indicator in a Ranging market is usually low because at this stage the price is slow and undergoing Accumulation or distribution stage. There is also a general indecision as to whether there is dominance of supply or demand so trading activities is reduced and we can see it in the volume indicator. Whenever the market breaks out of its ranging phase we can see that trade volume and volatility increases.
In the volume indicator we can observe that before the market slide into sideways movement the volume was high but became low in the ranging market and high again after the ranging market.
5. Explain the trade criteria for the three phases of the market. (show screenshots)
There are few criteria a trader should consider before trading in a bullish, bearish or ranging market and I'll be highlighting these below;
Bullish phase
Firstly, we must confirm that the price is experiencing higher highs and higher lows movement pattern.
Secondly, wait for retracement (trends usually move with pull-backs to cool off before proceeding) so we make our entry at lower point formed when the price retraces in a higher low
We can now add our stop loss and Take profit for risk management and to enhance chances of making good profits from trade. It is advisable to use 1:2 ratio or above because using 1:1 doesn't worth the risk most times.
Bearish phase
We first confirm the market is on a bearish phase by Identifying the lower highs and lower lows movement pattern.
wait for retracement in price movement and make your entry close to the lower highs points. This will help us make better profit in the downtrend.
Add your stop loss and Take profit, the Take profit ratio should be higher than the Stop loss so we are not removed from the position too early and to make way for better profits.
Ranging phase
Ranging phase is avoided by many traders because its very risky and unpredictable due to fact that price can move in any direction anytime and market movers are usually working to influence price movement at this phase. But with good risk management it is okay to trade in a ranging market using the following criteria;
The market should be moving sideways within a support and resistance levels which should be identified and observed for Breakouts.
Identify a Breakout (it is advisable to use a trend-based technical indicator for confluence) and also observe the volume indicator if there are longer bars to show higher trade volumes
Make your entry close to the strong level involved (support level or resistance level)
Add your stop loss and Take profit for risk management. Your stop loss should be lower than the strong level involved in the Breakout and Take profit ratio should be advisably above 1:1, maybe 1:2, 1:3 etc.
6. With the Trade criteria discussed in the previous question, open a demo trade for both Buy/ Sell positions.
Buy Position entry
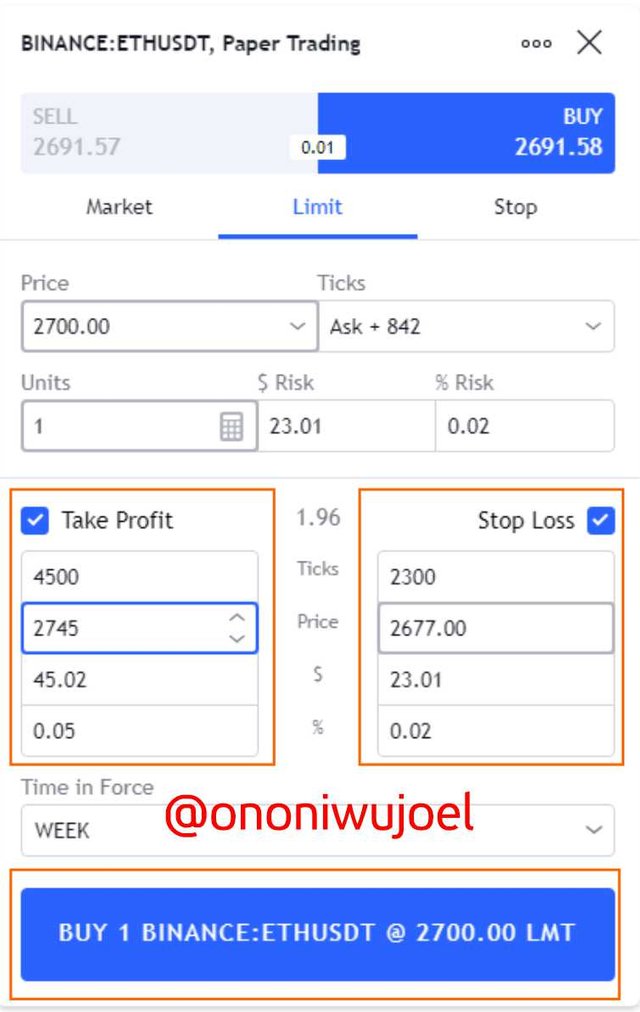
I'll be using ETH/USDT currency pair for this trade entry
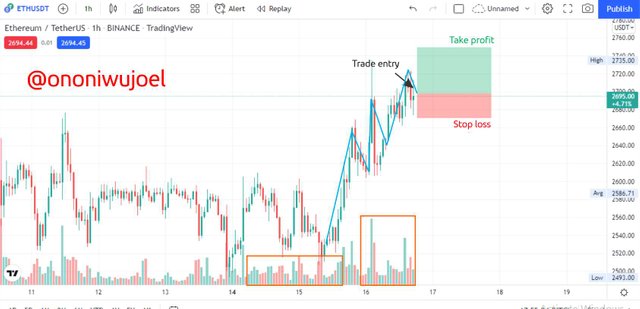
The chart above is a ETH/USDT pair with a 1hr time frame. We can observe that the asset has broken from a ranging phase into a bullish trend not long ago so we're now seeing higher highs and higher lows. We can also observe the high volatility and trade volume displayed by the volume indicator at this areas.
I waited for a retracement after confirming the bullish trend and then made my trade entry at $2700 with stop loss at $2677 and take profit at $2745 hence giving a Risk/Reward ratio of 1:2.
I used the Paper Trade in TradingView platform for this demo trade
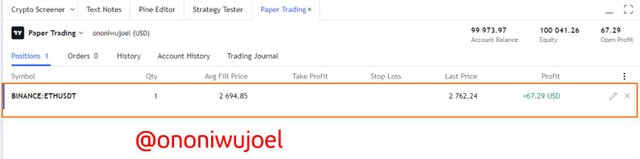
After some time I checked my trade order and it actually moved in the expected direction
Sell Position Entry
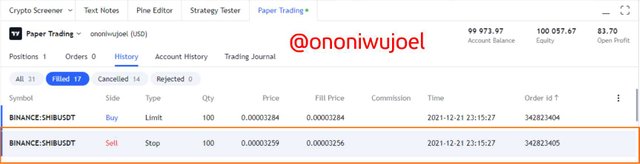
I'll be using SHIB/USDT currency pair for this trade entry
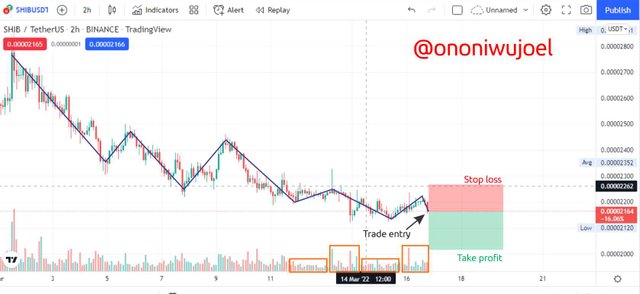
From the SHIB/USDT chart above with a 2hr time frame we can observe that the market is undergoing a bearish phase and we can see the repeated lower highs and lower lows in the price movement pattern. We can also see the volume indicator giving longer bars signaling voluminous trading activities in the market and at this stage volatility is high as well.
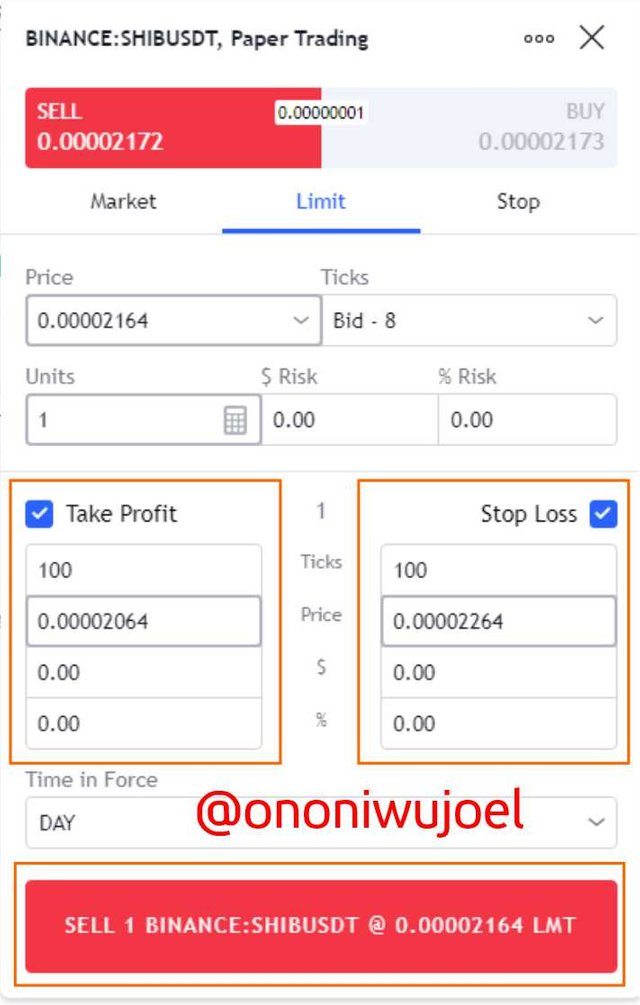
So I waited for a pullback in the price movement and then made my entry with stop loss and Take profit at a ratio of 1:1.
This is not a good ratio in trading but I opted for it because of the volatility and unpredictability being shown by the price movement.
I also used Paper Trade in TradingView platform for this demo trade
After sometime I went back to check my trade order
Conclusion
Dow Jones theory made very solid points that have served as the bedrock of technical analysis and price action. It gives hints on how the market structure works hand in hand with Market psychology and made it easier to understand markets and Trading technically.
We also discussed market phases, supply and demand and how to trade in different market phases to make profits and minimise losses.
Volume indicator was also highlighted in our study and we saw how to observe trading activities in the market and volatility using this technical tool.
Finally I was able to make demo trade entries using the information learnt in the lecture
It was a great lecture and I do appreciate it
Cc: Professor @reminiscence01
You've got a free upvote from witness fuli.
Peace & Love!