Fibonacci Tools - Steemit Crypto Academy |S6W4| - Homework Post for Professor @pelon53
Hi Professor @pelon53 I am @ononiwujoel one of your students in Crypto Academy and a member of the steemit platform and this is my homework submission post from your lecture Fibonacci Tools


1.- Explain in your own words what you mean by Fibonacci retracement. Show an example with screenshot.
Fibonacci numbers which is the bedrock of Fibonacci retracement is a mathematical series authored by a reputable mathematician in the middle ages.
Fibonacci retracement in trading is a technical analysis strategy that identifies important areas of support and resistance using Fibonacci sequence ratios.
The idea behind this is the fact that a trending market does not move in a straight line, it involves pull-backs known as retracement as trader take profits from the market before the trend continues. We have no idea how far the retracement will go generally hence the use of Fibonacci retracement strategy to calculate the retracement and identify good trade entry spots.
Fibonacci retracement tool can be found in many trading platforms. This technical tool uses Fibonacci levels including 23.6%, 38.2, 50%, 61.8%, 78.% of which 50% that is not really a Fibonacci number is added because it is an improvement level in price movement and signify a balance or midpoint. Fibonacci retracement also uses the golden ratio which places the estimate between two numbers in the series at 1.618 level.
Fibonacci retracement tool is drawn between the starting point and endpoint of an trend to analyse retracements and identify support and resistance levels for trade entry and exit during a trending market and for counter-trend trading.
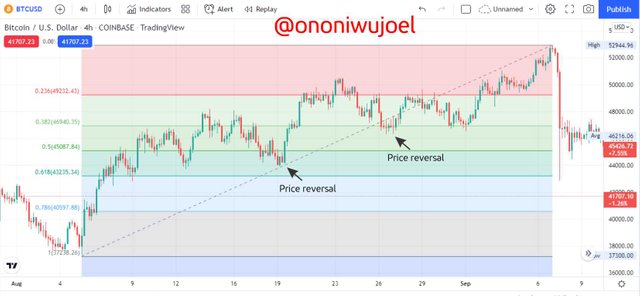
The chart above gives us an illustration of Fibonacci retracement tool. We can see the market is on an uptrend and there are measured retracements and trend reversals after the retracement in some points but the general uptrend continues after each one of them.
Now each of this measured retracements and price reversals can serve as a good trade entry spot to traders because you can buy at lower prices at these points and sell as the bullish advances further.
2.- Explain in your own words what you mean by Fibonacci extension. Show an example with screenshot.
Fibonacci extension is a technical tool very similar to the Fibonacci retracement tool and uses same sequence ratios which serve as support and resistance zones for calculation but this tool is used to calculate trend extension instead. The idea behind this technical tool is the fact that whenever a market is trending in a particular direction it does so with pull-backs after which the trend continues, so this tool help us measure how far the price can go after a pull-back before the next pull-back.
The Fibonacci extension tool is commonly used to analyse trend continuations and identify good spots for trade entry. Commonly used levels in the Fibonacci extension include 1.272, 1.414 and 1.618.
The graph is plotted starting from the beginning of the trend to the retracement and then to to the end of the retracement.
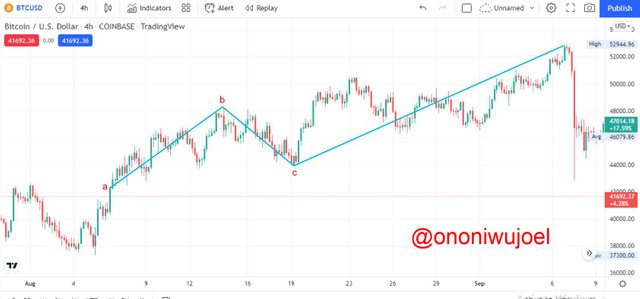
The image above gives an illustration of how the Fibonacci extension tool is drawn on a chart. We started at the beginning of the trend marked (a) to the pull-back market (b) and finally to the end of the pull-back marked (c) then we can study how far the price is likely to go before another pull-back.
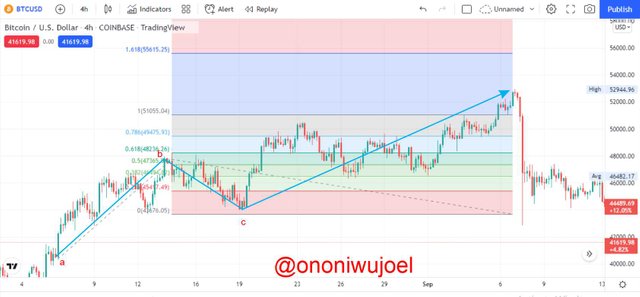
The diagram above shows the Fibonacci extension applied to our chart. We can observe that the price moved in an uptrend from point (a) to the point (b) where there is a pull-back to point (c) after which the price returns to the bullish trend. The Fibonacci extension tool here measures the price trend before a retracement occurs again and from the chart we can see that the price is extended to the point 1 (51055.04) before the another strong retracement.
Fibonacci tools are very effective for trading in a trending market and counter-trend trading as it gives important information on levels that can serve as support and resistance in the trending market amid retracements and extensions. So trading with these tools gives a trader the advantage of easily identifying good spots for trade entry, stop loss and Take profit.
3.- Perform the calculation of the Fibonacci retracement, for the levels of: 0.618 and 0.236. Pick a crypto pair of your choice. Show a screenshot and explain the calculation you made.
The formula for calculating Fibonacci retracement is;
RX = X + [(1 - %Retrace 1/100) * (Y - X)]
Where:
X = The price at beginning of Trend or the beginning price value
Y = maximum price before retracement or ending price value
Retracement levels are;
% Retrace 1 = 23.6%
% Retrace 2 = 38.2%
% Retrace 3 = 50%
% Retrace 4 = 61.8%
% Retrace 5 = 78.6%
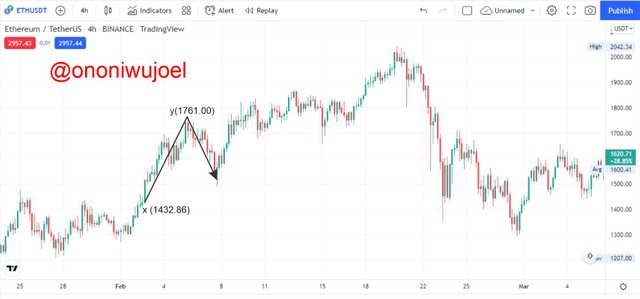
I'll be using ETH/USDT chart to calculate the retracements in this section
0.618 Fibonacci level
Recall our Fibonacci retracement formula;
RX = X + [(1 - 0.618) * (Y - X)]
Where;
X = 1432.86
Y = 1761.00
RX = 1432.86 + [(1 - 0.618) * (1761.00 - 1432.86)
RX = 1432.86 + (0.382) * (328.14)
RX = 1432.86 + 125.349
RX = 1558.2
We can compare our RX value to our chart
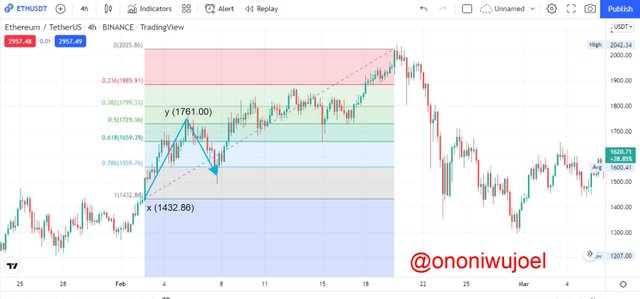
0.236 Fibonacci retracement level
RX = X + [(1 - 0.236) * (Y - X)]
RX = 1432.86 + [(1 - 0.236)(1761.00 - 1432.86)
RX = 1432.86 + (0.764)(328.11)
RX = 1432.86 + 250.67604
RX = 1683.5

4.- On a Live account, trade using the Fibonacci retracement, screenshots are required.
I will be using TradingView platform for my technical analysis while the trade will be executed with my Huobi Global account for this section.
I'll be using SOL/USDT currency pair for a Buy Trade entry.
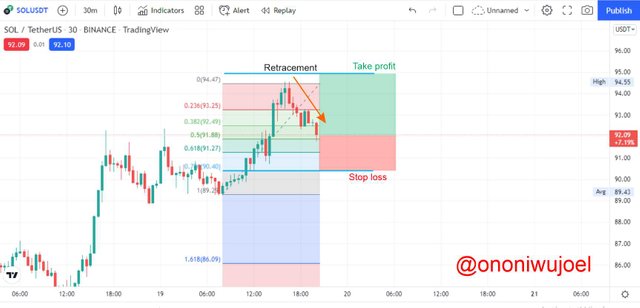
From the chart above we can observe that a bullish trend began at $89.43 and continues to the $94.5 point where a retracement then starts down to my entry point. Adding our Fibonacci retracement tool we can see that our entry point is a key level close to the 0.5 level and we can also observe that this level have served as a resistance before.
So I made my trade entry at $92 which is very close to the 0.5 on the Fibonacci retracement tool with my stop loss at $90.5 which is also at the 0.786 level in our Fibonacci ratio and Take profit at $94.5 which is at 0 level in the Fibonacci ratio. Thereby giving us a Risk/Reward ratio of 1.5:2.5.
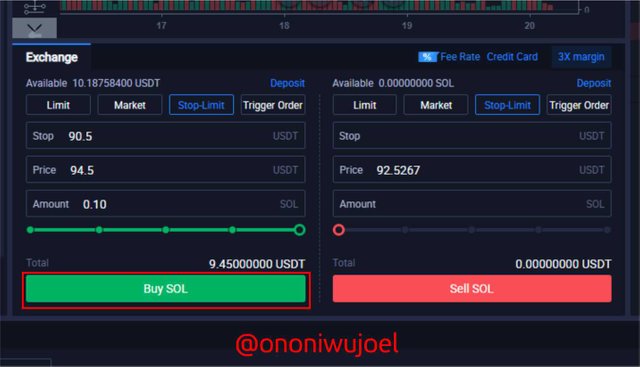
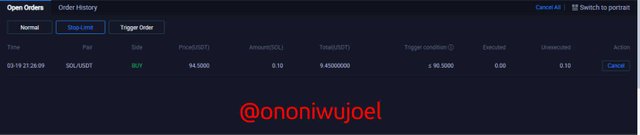
Trade history below, awaiting execution
5.- On a Demo account, make a trade operation using the Fibonacci extension. Screenshots are required.
I will be using TradingView platform for the technical analysis and application of tools then I'll use Paperview for the demo trade entry in this section
I'm using LUNA /USDT currency pair for a Sell trade
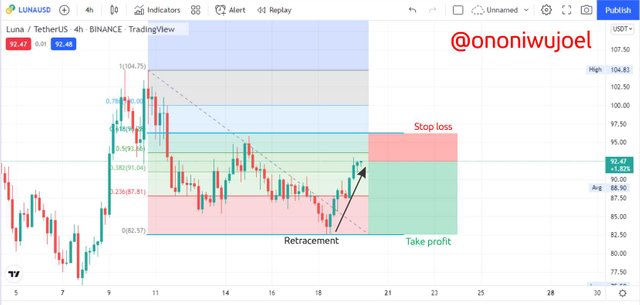
In our chart above we can observe that a bearish trend began at $102.5 and down to $82.5 where a pull-back started to the point of my trade entry. We can also easily observe that a retracement have occurred before this one so it is very likely to repeat same pattern.
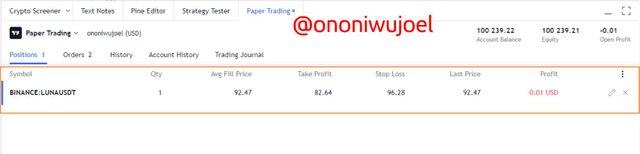
I made my trade entry at $92.47 which falls in between the 0.5 and 0.382 levels on the Fibonacci tool. My stop loss is at 96.28 which is same level with the 0.618 ratio on our Fibonacci tool, my Take profit is at $82.64 which is very close to the 0 level on the Fibonacci tool. Giving a Risk/Reward ratio of 1:3.
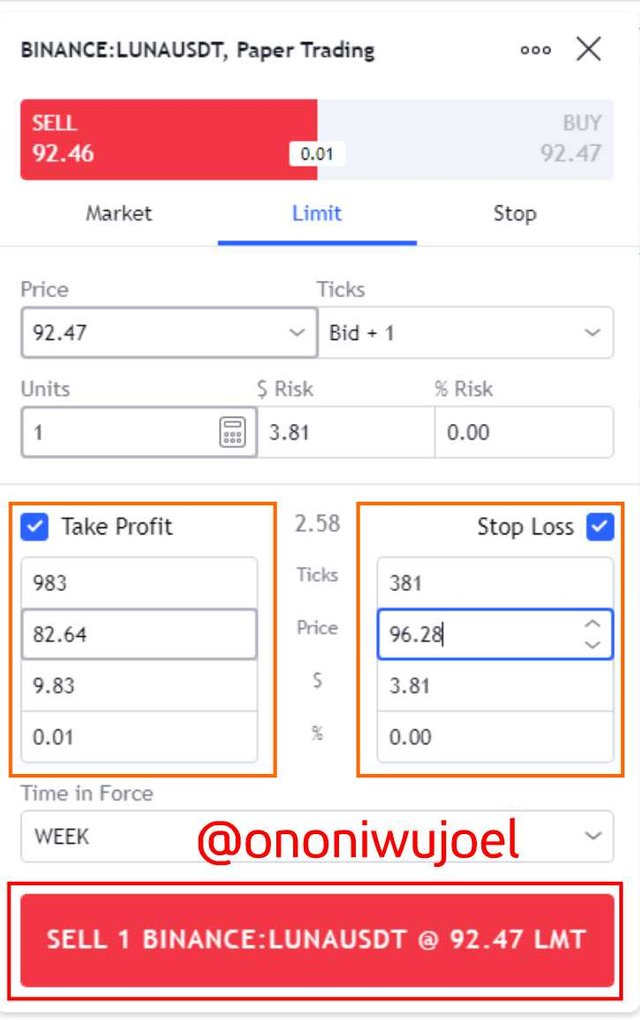
Trade history below as position await execution
Conclusion
Fibonacci tools have made its mark as a great technical analysis strategy for analysing price movement in a trending market and giving good spots for trade entry.
Trending markets have the highest number of traders because it is very lucrative and less risky compared to the ranging markets but several traders still don't trade between the pull-backs in trend movements because it is risky and unpredictable but thanks to Fibonacci Tools, it has made it a lot easier to trade using counter-trend strategies and Trading with retracements and extensions effectively.
Fibonacci tools are also good for forecasting possible trend movements and how far the are likely to go.
It was a great lecture and I really do appreciate it
Cc: Professor @pelon53