Crypto Trading by Identifying Support and Resistance - Steemit Crypto Academy - S6W3 - Homework Post for @shemul21
Hi Professor @shemul21 I am @ononiwujoel one of your students in Crypto Academy and a member of the steemit platform and this is my homework submission post from your lecture Crypto Trading by Identifying Support and Resistance


1. What is the Support & Resistance zone?
Support and Resistance zones are one of the basic and most important data used in price action and technical analysis. These zones are usually represented by lines on the chart highlighting the areas with highest liquidity due to the increased supply and demand concentration as traders place their orders at the zones.
The interaction between sellers and buyers in the market creates a price range having a higher limit and lower limit and these levels are used by traders to make their Buy and Sell trade entries and as a result we have higher trading activities on these zones as several orders await execution. Whenever the price interacts with any of these levels it usually rebounds and the strength of a support or resistance level depends on the number of times it is able to repel price movement successfully.
Support zone
Support zone is the lower limit of a price range and represents the level of high demand as traders place their Buy orders at this zone. Whenever the price interacts with this zone it is expected to either rebound to show that there are more buyers than sellers at the zone or get broken if the number of sellers are more than buyers.
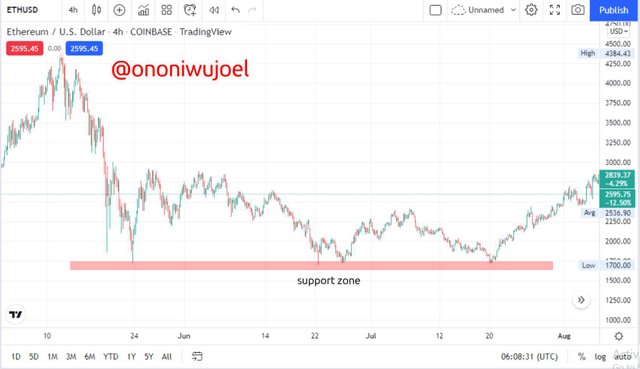
The chart above gives an illustration of a support level. We can observe the price getting repelled whenever it comes in contact with the level
Resistance zone
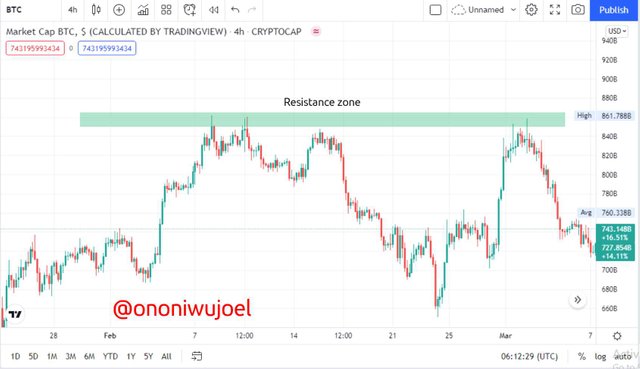
The resistance zone is a direct opposite of the support zone. This is the level with more sellers hence preventing the price from going upwards. It serves as the upper limit of the price range and repels the price whenever they interact. This is the level of distribution or supply and will only get broken in a strong bullish market.
Below we have a chart showing an example of a resistance zone
2. Explain different types of Support & resistance with proper demonstration.
We have three basic types of support and resistance zones which are Horizontal support and resistance levels, sloping levels support and resistance and dynamic support and resistance levels. So I'll be explaining them one after the other below.
Horizontal Support and Resistance
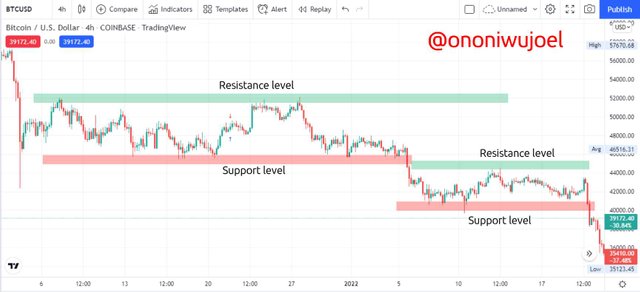
The horizontal support and resistance levels is the most commonly used type of support and resistance because it is easier to identify and understand. This support and resistance zones are represented by horizontal lines connecting a number of historic data points that are relevant to the levels. In the case of a resistance level the horizontal line identifies the areas of high supply or distribution where the number of sellers is greater than that of buyers hence preventing the price from going upwards, this level shows us areas where the price have been repelled repeatedly after interacting with the level.
On the other hand, the support level is represented by a horizontal line which serves as the lower limit of the price range at a given period of time. This is the highest zone of demand where we have more buyers than sellers hence preventing the price from going downwards. The horizontal support connects areas where the price has rebound repeatedly after interacting with the level.
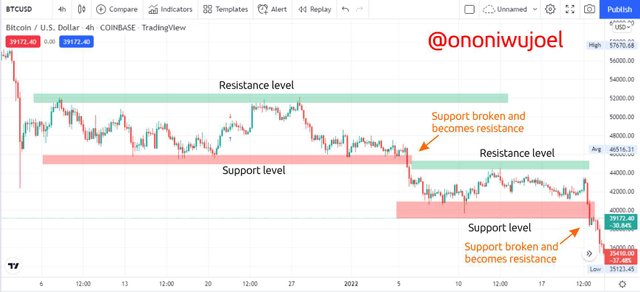
There are also cases where the market becomes bullish or bearish thereby breaking through the resistance or support zones respectively.
In cases like this, when a resistance is broken due to increasing demand the resistance is expected to become a support level and likewise when a support zone is broken due to increasing distribution overwhelming the demand in the market, the support level is expected to become a resistance level.
Sloping levels Support and Resistance
The sloping levels support and resistance is more complex than the horizontal levels and are very effective in trending markets. The sloping levels support and resistance connects the higher highs and lower highs in a resistance level or the lower highs and lower lows in a support level just like a trendline. Infact this type of support and resistance zones are also known as Trendlines. They help to identify the market structure and market psychology by showing when the price is rising or falling due to demand and supply rate in the market. And they also help to easily identify reversals, broken levels and trade opportunities in the market
I'll show examples of support and resistance sloping levels below so we can see the difference
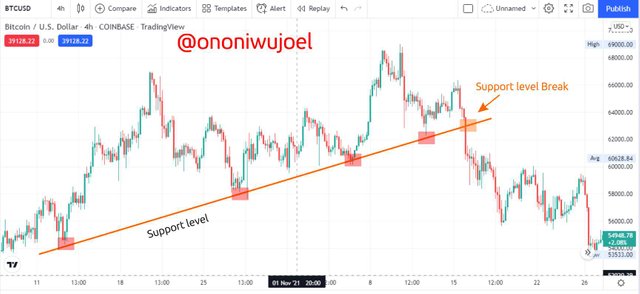
The chart above is a sloping level support. We can see that it is represented by a straight line connecting data points in a slope which is due to price movement and retracements to continue its trend. The support continues until there is a break which implies a trend reversal.
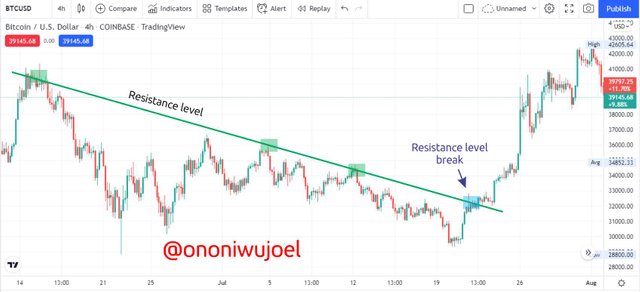
The chart above gives us an illustration of a sloping level resistance. This is also represented by a straight line connecting relevant data points of price movement, in this case the higher lows thereby forming a sloping movement of Trend continuation. Whenever there a break of this resistance it signals a trend reversal
Dynamic Support and Resistance
Dynamic support and resistance is the most complex among the trio. These are not not drawn by the trader like the horizontal and sloping levels but are rather identified via the use of technical indicators like bollinger bands, moving averages and others. This type of support and resistance is well calculated using historical data points and are mostly represented by moving lines on the chart.
I will be using the Moving Average indicator to illustrate dynamic support and resistance levels. Moving Average is the most popular and commonly used indicator in technical analysis because it is very easy to understand and is also very effective in trending markets.
Moving Average calculates the average price of the asset over a given period of time and is represented by a moving line which moves along with the price hence forming a dynamic resistance in bearish market and a dynamic support in a bullish market.
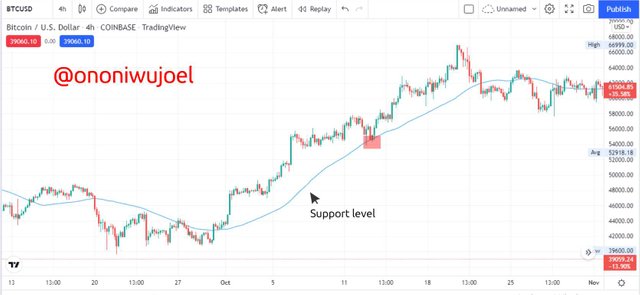
From the chart above we can see a clear example of the Moving Average serving as a dynamic support in a downtrend. Another advantage of using this type of indicators is that it makes it easier to identify a broken level and trend changes and as such make traders easily spot good trade opportunities early enough.
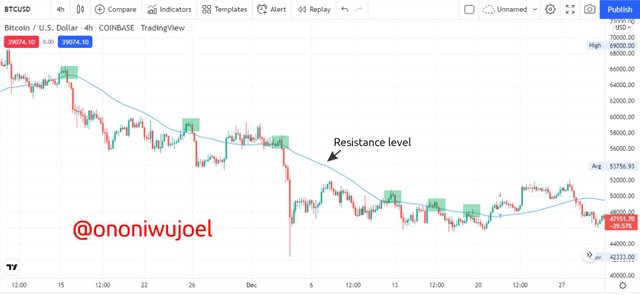
The chart diagram above shows an illustration of a dynamic resistance level formed by a moving average line in a bearish market. We can also see how the price gets repelled whenever it interact with the resistance level and when the level gets broken. Dynamic level is very effective and preferable in a trending market.
3. Identify The False & Successful Breakouts. (demonstrate with screenshots)
Resistance and support levels like we already are areas of high trade activities and market entries which increases the liquidity and momentum of the market at these zones. However there are times when these levels get overrun due to the increased trade momentum and market volatility and this is what we refer to as a Breakout.
A Breakout can happen at the resistance or support zones and creates good spots for trade entry as many traders seek to utilize the opportunity to place their orders early so as to benefit from the Breakout and trend change.
There are also two types of Breakouts which are the successful Breakout and the false Breakout of which the former is very profitable to traders while the later can lead to severe losses should a trader use it to make decisions.
Successful Breakout
A Breakout is said to be successful when the price breaks through a support or resistance level, closes after the break and continues in the expected direction. Such Breakouts are good opportunities for trade entry. This Breakout occurs when demand overwhelm supply in a bullish market or when supply overwhelms demand in a bearish market.
A successful Breakout can occur as a trend continuation or trend reversal
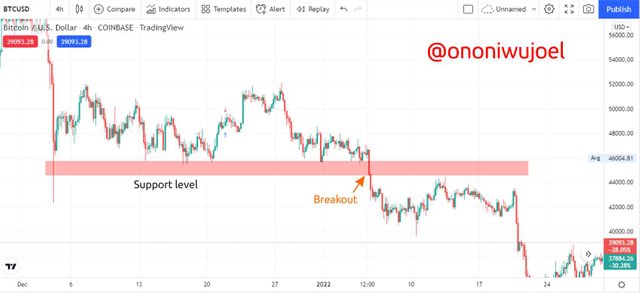
The chart above shows us an example of a successful continuation breakout and we can observe the price rebound at the support level a number of times showing that is respects the zone as its lower limit of price movement but at a point it breaks through the support and closes after the support which is now a resistance level. This shows that the number of sellers in the market is greater than the buyers and will be a good trading opportunity for traders that identified the spot early enough
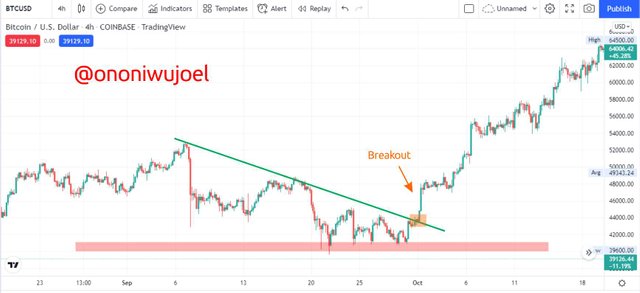
We also have the Reversal Breakout as illustrated by the chart above. We can see horizontal support and the sloping resistance level which keeps making lower highs until the level experiences a Breakout which is followed by a strong bullish market. The Reversal Breakout although successful can be confusing if the trader don't observe properly and use the required tools to analyse the chart and it is also very profitable if the trader is able to successfully analyse and spot the opportunity, we can confirm this statement from the chart above.
False Breakout
False Breakouts usually falls under same category with false trade signals and can be disastrous in trading. This occurs when prices briefly breaks the support or resistance zone and closes over the zone but fails to continue in the expected direction but instead rallies towards the opposite direction thereby resulting in severe losses to traders that would have assumed its a real Breakout and made their entries. This Breakout is often caused by Whales and huge liquidity providers who tries to influence the market in their own interests but the signal is then followed by many smaller accounts and unsuspecting traders to their own peril.
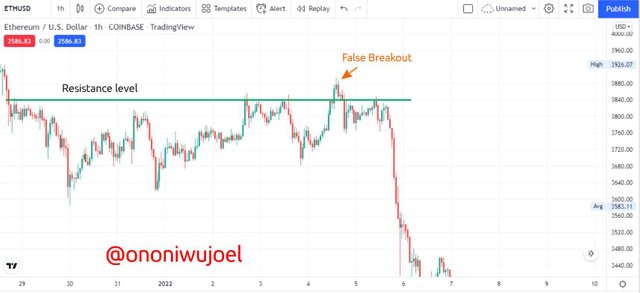
The chart above gives an illustration of a false breakout, we can observe the price briefly breaking through the resistance area and closing above it but then swings in the opposite direction and starts a strong bearish. You can now imagine the loses traders will sustain in this trade especially those that don't use risk management measures.
4. Use Volume and RSI Indicator Combined with Breakouts & Identify the Entry Point. (demonstrate with screenshots).
Due to the high volatility and constant price movement swings in the market it is always advisable to use technical indicators for confluence when trading with Breakouts to confirm the signals and filter false signals and market noise. In this section I'll be using RSI indicator and Volume with our Breakout to identify good spot for trade entry
Volume is a very popular technical tool in technical analysis. It is relatively simple, effective and understandable. It is represented by vertical lines (bars) at the bottom of the chart showing volume of trade entries at a given period of time. It also shows the trade momentum and market volatility ratio with respect to time. Volume includes two types of lines (bars) which are the bullish (green) and bearish (red) and shows the rise and fall of trade volume by the length of these bars. When the trade momentum is high we'll see longer bars and when the momentum is low we see shorter bars while the colours show if its bullish or bearish.
The Relative Strength Index Indicator also known as the RSI just like it's name implies is a technical indicator that calculates the relative strength of trends and shows when the asset is overbought or oversold. This indicator is represented by a graph below lines that show the trend movements. It also has range limits of 70 and 30 which show when an asset is overbought or oversold respectively.
Now I'll combine these indicators with a Breakout to identify a good spot for trade entry.
Buy Trade Entry
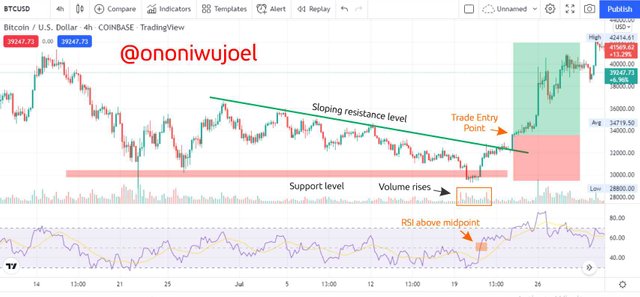
For a Buy trade we'll first identify our strong resistance and support levels and then identify a Breakout. In this case we can see that the price have reacted a number of times with out horizontal support and we can also observe that the price has rebound repeatedly after interacting with our sloping resistance level. At the point of Breakout we notice there is an increase in momentum by the Volume indicator showing that the market has an increase in trading activities at this stage. We can also observe the signals from our RSI indicator that the price have risen above the midpoint while the second line has crossed below the main line thereby confirming the trend reversal, increased trade momentum and bullish.
I can now make my trade entry after the Breakout with stop loss and Take profit after achieving confluence from the indicators.
Sell Trade Entry
For the Sell trade entry we also start by Identifying our support and resistance zones, spotting a Breakout and then combining with our RSI and Volume technical indicators.
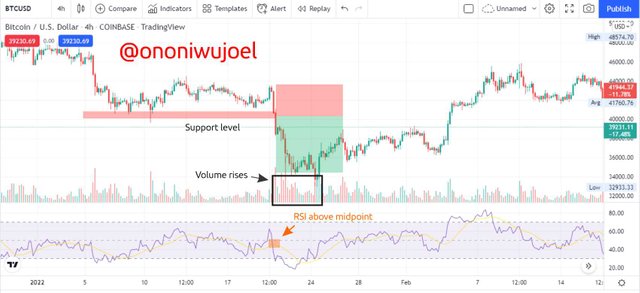
From the chart above we can observe the Breakout occurs at the support zone and is followed by some bearish candles which helps it rapidly run a bearish trend.
We can also observe the increasing length of the volume bars signalling a high volume at this stage and we can observe from our RSI that the price now run below the mid-point thereby signalling a strong bearish.
I can now make my Sell trade entry at this point with stop loss and Take profit for risk management.
5. Take a Real Trade(crypto pair) on Your Account After a Successful Breakout. (transaction screenshot required).
I will be using LUNA/USDT currency pair to execute a real trade in this section.
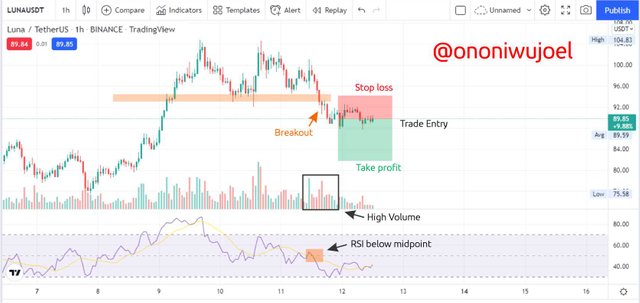
From the chart above we can observe that market was initially on a bullish trend after which it got exhausted and entered a ranging market stage and after a while there was a Breakout on the support zone ushering another phase of bearish market.
Using my technical indicators I'm able to confirm the signals and ascertain the spot for trade entry.
The RSI indicator below shows that the price rapidly moved below the mid-point and continued in that direction indicating a strong bearish and we can also observe from the volume indicator that there is an increased trade momentum and market volatility at the stage.
So I made my trade entry at $89.8 with stop loss at $92.8 and Take profit at $83.8 giving a Risk/Reward ratio of 1:2.
Im using my Huobi Global account to execute the trade order
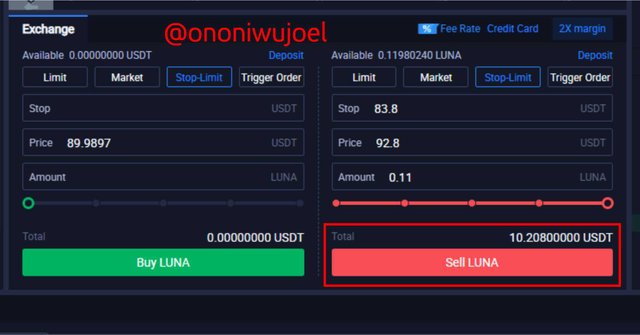
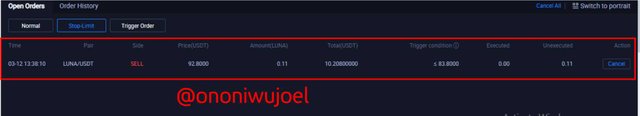
I've successfully made my trade entry and all I have to do is wait for the order to be executed
6. Explain the Limitations of Support & Resistance (false breakout).
There is a popular opinion in trading which believes that no strategy is 100% efficient and to a large extent this has proven to be true.
Although support and resistance are excellent basis for trading and technical analysis there are still loopholes that makes it limited to an extent and foremost of them is False Breakouts.
This loophole may not seem so dangerous but is actually very dangerous because using support and resistance alone it may be quite difficult to tell when a Breakout is false as some of them will actually make the price close across the resistance or support zone as the case may be but afterwards the Breakout fails and starting accelerating in the opposite direction causing lots of losses to traders that tried to take advantage of the early Breakout signal.
The chart above gives us an illustration of a false breakout and we can see that this Breakout actually seemed like a continuation Breakout on the resistance zone which may have made several traders to opt for a Buy Trade entry but afterwards we can see the serious bearish that followed so any trader that may have used this signal is sure to incur heavy losses
Conclusion
Support and Resistance zones remain a basic requirement for price action and technical analysis and every trader should have an understanding of how they are used to study charts and market structures. Breakouts are another important part of technical analysis because it is one of the most effective ways to spot trade opportunities and these are only made available via support and resistance levels so they're a kind of intertwined in each other.
In as much as Breakouts are potent data for market entries we should also beware of false Breakouts as this is also very disastrous to trading. The best ways to avoid false breakout and other false market signals is via the use of technical indicators for confluence to confirm any signals received from charts.
It was a great lecture covering the basics of trading and I appreciate it so much.
Cc: Professor @shemul21