UNDERSTANDING TRENDS (Part II) - Crypto Academy / S5W3- Homework Post for @reminiscence01".
It is another privilege to join another class of @reminiscence01 in the week three of season five of the Steemit Crypto Academy. It's been a good indept Understanding of trends in the Cryptocurrency market. However, here is my work exercising my knowledge of the subject matter.
Image self created on Canva

A market trend is the overall direction of price over a period of time. The price action of a particular asset or crypto pair would be referred to as a trend if there is an overall increase or decrease in price over a period of time. An overall increase is called an Uptrend or Bullish Trend while an overall decrease is called a DownTrend or Bearish Trend. However, the crypto market is structured in cycles or seasons where there are alternating inter-switch between the trends. That is, at some point, the market goes Uptrend and at some point it reverse the current trend to go in opposite trend.
A Trend Reversal is thus referred to as a change in the overall price action of the market. An uptrend would reverse to a down trend while a DownTrend would reverse to an UpTrend. As learnt in the last lesson, the trend of a market can be Identified using a number of parameters such as Price action, Market Structure, Trendline or an indicator. The market structure of an UpTrend is a build up of higher highs and higher lows and the trend would pose a reversal if the price of the new low drops below the previous low. The trend reversal of a Bullish Trend means the market structure changes from higher high and higher low swings to form lower high and lower lows.
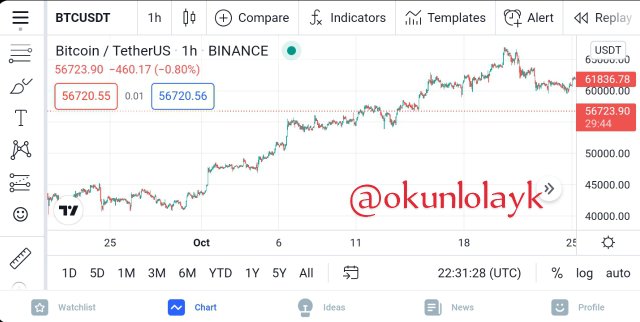
An Example of a Bullish Trend:TradingView
Similarly, the trend reversal of a Bearish Trend means the market structure changes from lower highs and lower lows swing to form higher highs and higher lows.
The economic significance of a trend reversal simply depicts a switch of market dominance from the buyers to the sellers or vice versa. There is a Reversal in bullish trend when the buyers could no longer push the price higher and giving room for the sellers to take over to bring it down.
Identification of market trends helps traders to make wise decisions in entering or exiting the market. The trader would be able to decide when to place an investment or when to pick profit as well as when to go short or long trade. Using a Trendline as an indicator would help traders clearly see the rejection level (support or resistance) and can be rest assured he is following the trend.
b) How can a fake reversal signal be avoided in the market? (Screenshot needed).
In some case the violation of a market trend could be temporary and does not necessarily result in a Trend Reversal but translate into a retracement of the current trend. Using the market structure or price action alone might not give an accurate precision of a market trend. At times there could be opposite trend indication from the market structure where as the market market remains in its current trend. This fake reversal signal can be avoided using multiple indication parameters such as the market structure in confluence with indicators in determining the market trend.
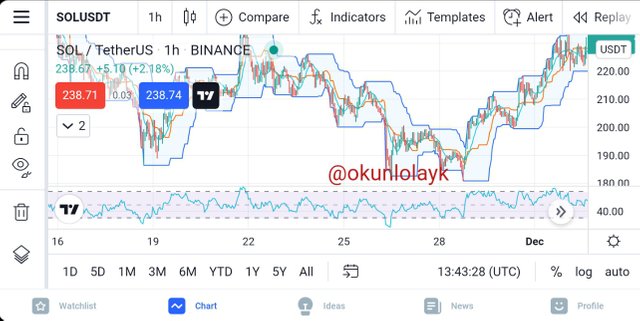
TradingView
Give a detailed explanation on the following Trend reversal identification and back up your explanation using the original chart. Do this for both bullish and bearish trends (Screenshots required).
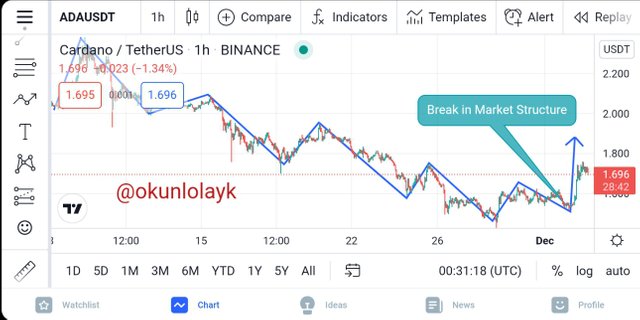
Break of market structure
As briefly mentioned earlier, the market structure can be used to observe the market trend and know how the price action is performing. This shows the degree of competition between the buyers and sellers in the market. The market trend choose to pull upward if the buyers are predominant in the market, while the market trend will pull down if the sellers dominate the market. However, to maintain a market trend continuation, there are rules relatively guiding the price action. A violation of this rule will signal a weakness in the trend and a potential reversal. At this point the dominant players of the market are losing power to their counterpart who would take the trend in opposite direction.
For example, in a Bullish Trend, the market structure shows consecutive higher highs and higher lows along along an Uptrend. The trend will continue if a new low does not fall to reach the previous low otherwise it signals a weakness and predict a break of trend- As shown below:
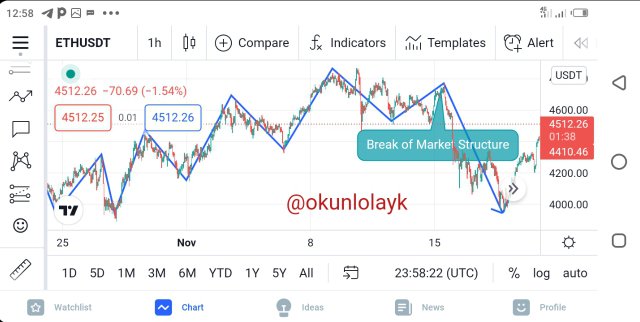
TradingView
In a Bearish Trend similarly, a the market structure creates lower highs and lower lows along the Downtrend, and the trend will continue if a new high does not grow high enough to reach the previous high, otherwise it signals a weakness and predicts a break of the trend. See below:
TradingView
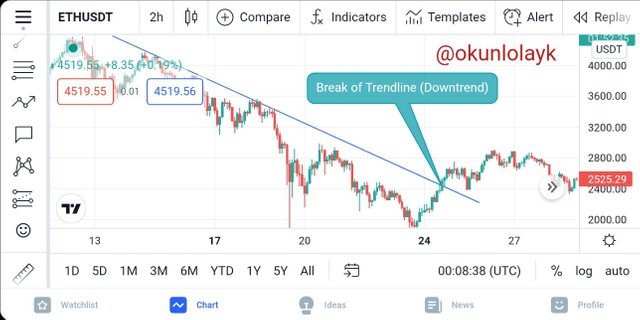
Break of Trendline.
The Trendline is also an indication to visualize a market trend. It is used by drawing a line along points (at least two points) along a trend. The Trendline is drawn along at least two low points along a UpTrend which indicates a support level for the Bullish Trend. Similarly, the Trendline is drawn along at least two high points along the down trend which indicates the resistance level for the Bearish Trend.
In a Bearish Trend, the trendline forms the resistance level and the price bounce off or reject this line. Any attempt of the the price action to cross or break the line is a strong signal of a trend reversal.
TradingView
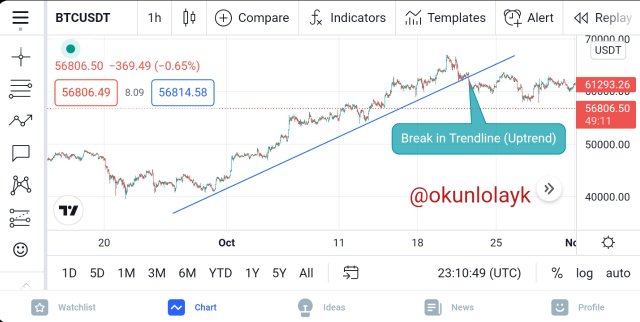
Similarly, the Bullish trend has the trendline indicating it's support level and price tends to bounce off or reject this level. An attempt of the price Crossing or breaking through the line is an indication of a trend reversal. This can be seen in the chart below;
TradingView
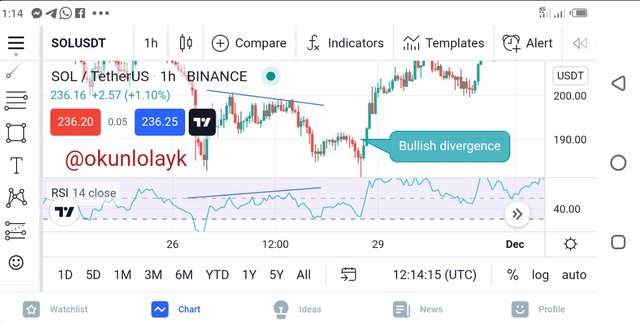
Divergence
Divergence occur when there is a mix reaction between a price action and a relative indicator. This is when the price action point towards a trend direction while the indicator points to an opposite direction. This divergence is an early indication of a trend reversal in the market. A divergence could be Bullish or Bearish.
In a Bullish divergence, the price action forms a new low while the indicator forms a new high. This is oppositely divergent market reaction and it signals a weakness and a potential reversal towards a bullish direction. In a scenario like this a trader is placed with an early information signal of an upcoming bullish trend and enables him to take advantage of the market by reaching out for a buy Position.
TradingView
In a bearish divergence, the price action forms a new high whereas the indicator forms a new low. This signal a reversal of the current trend towards a bearish direction. This divergence signal an early information for a trader to take advantage of the market and find a sell Position.
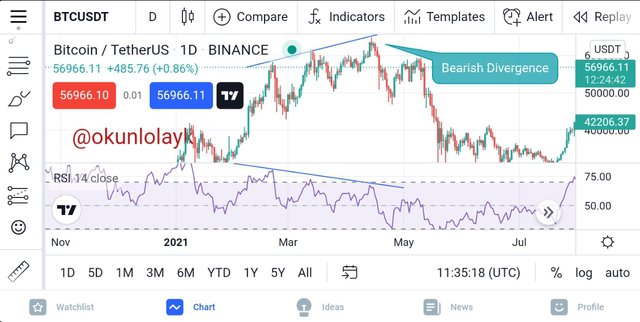
TradingView
Double top and Double bottom
The Double top and Double bottom both gives an indication of a trend reversal in the market. The Double top occurs in a bullish trend when there is a retracement in the uptrend and the new high attempt to retest the previous high without breaking out. The double top shows the trend is weak and the buyers could not push price further high to continue the uptrend and thus a potential trend reversal is predicted.
At the Double top, the new price must not break the previous high and the closing price must not exceed the previous high.
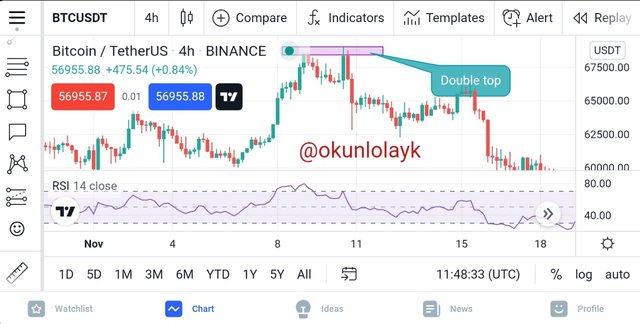
TradingView
Similarly the double bottom, occur during Bearish trend when there is a retracement in the Downtrend Continuation and the new low attempt to retest the previous low without breaking out. The double bottom shows the trend is weak and the sellers could not push market price further low to continue the Downtrend and thus a potential trend reversal is predicted.
At the Double bottom, the new price must not break the previous low and the closing price must not fall beyond the previous low.
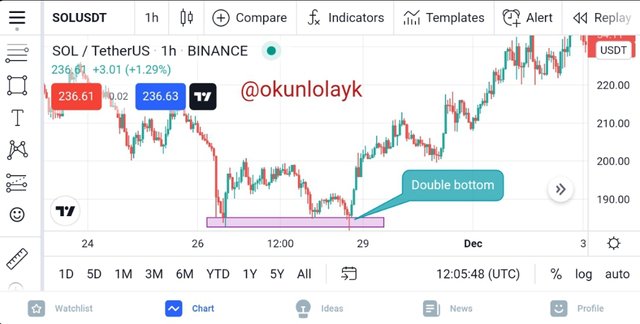
TradingView
Place a demo trade using any crypto trading platform and enter a buy or sell position using any of the above mentioned trend reversal/continuation pattern.
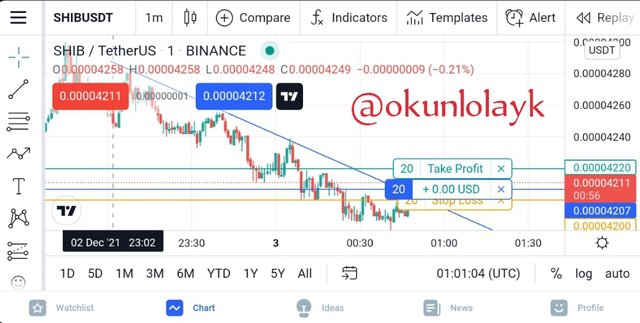
To complete this task, I wish to trade in the SHIB/USDT market. I use the mobile trading view platform where I can use the demo account to practice trading and exercise what has been learnt in class. In this demo trade I used the Trendline to understand the current trend of the market and at the same time used it in visualizing the resistance level of the current market Downtrend. At the point of trade I could predict a trend reversal as this could be following the Break of Treadline technique. As it is shown in the chart below, the price action resoects the resisitance for a period of time and at a point decided to break through the line. This is a good time to make a buy order has it is expected of the trend to reverse in opposite direction.
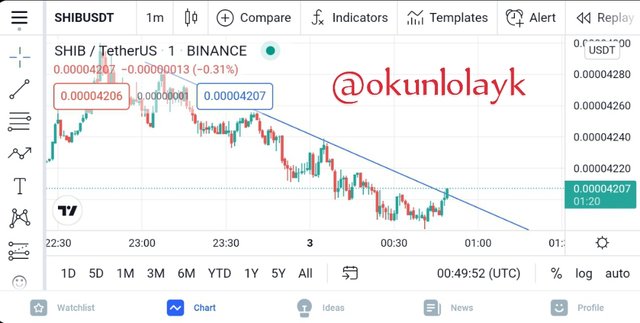
TradingView
In order to take advantage of the market, I placed enter an entry to buy 20Shib at 0.00004210 USDT each. Moreover, I Automated my stay in the market by using the pick profit and stop loss function. I expect to pick profit at 0.00004220 and my loss should be stopped at 0.00004200 at a 1:1 profit-loss margin.
As expected the trend did reversed in the opposite direction and earned me my profit.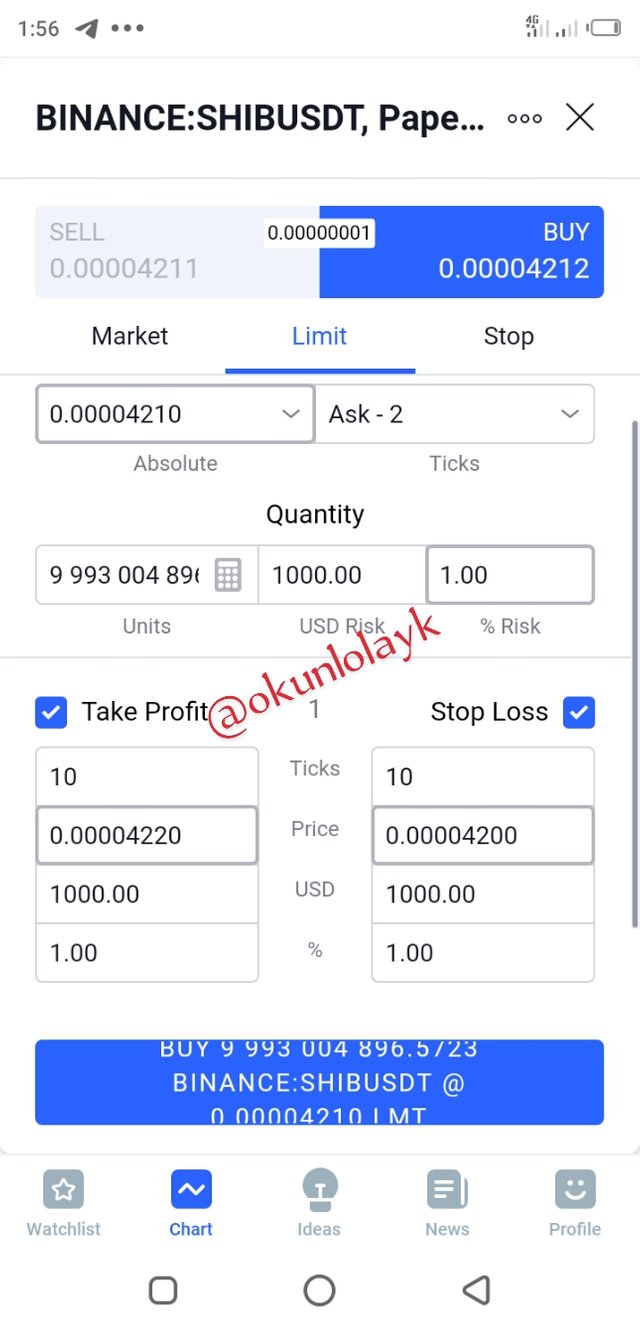
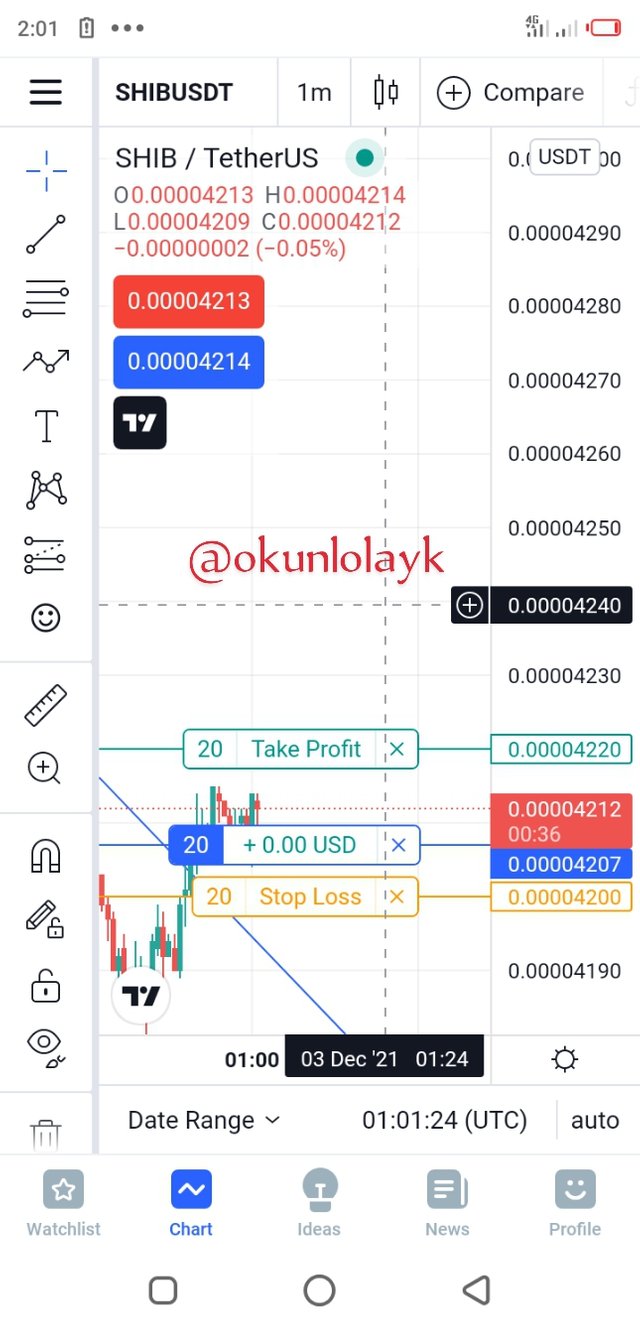
TradingView
And not just stop there but keep growing high.
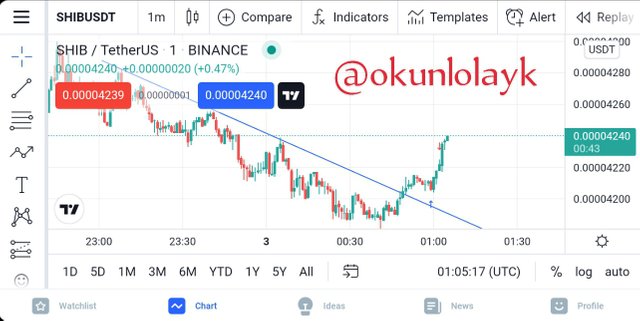
TradingView
Conclusion
The significance of a trend reversal study is to be equipped with information beforehand ahead of a reversal in the current trend. The trend reversal depicts a switch of market dominance from the buyers to the sellers or vice versa. There is a Reversal in bullish or bearish trend when the buyers could no longer push the price higher or the sellers could no longer pull the the price down respectively. Using multiple indication signals from parameters such as price action, market structure, indicators and strategic techniques can provide traders with adequate information to make wise decisions in opening or closing trades

Best Regards!!

Hello @okunlolayk, I’m glad you participated in the 3rd week Season 5 of the Beginner’s class at the Steemit Crypto Academy. Your grades in this task are as follows:
Recommendation / Feedback:
Thank you for participating in this homework task.