Steemit Crypto Academy / Season 4 Week 2 - Homework Post for @reminiscence01 | Technical Indicators by @obikay
background
Hello everyone,
I humbly welcome you all into another interesting season 4 week 2 lecture by professor @reminiscence01, and am happy to be a part of this class on Technical Indicators.
1. a) In your own words, explain Technical indicators and why it is a good technical analysis tool.
Technical indicators are calculations gotten from price and volume data.
Technical indicators have three main functions: they offer alerts, predict and confirm the behavior or movement of price. A technical analyst makes use of these Indicators to recognize occurrences that possibly might occur in future and also to recognize possible trade chances.
Technical indicators, perhaps can be used on charts of stocks, currencies, and some other assets that are tradable. Some of the Indicators have their standard parameters which is adjustable to fit in with strategy that is in use.
b) Are technical indicators good for cryptocurrency analysis? Explain your answer.
Yes, I must say they are absolutely good in the sense that they;
Technical indicators assist the trader in better knowledge of the crypto markets condition. They can tell if the market is trending that is moving up or downwards and assisting the trader in good decision-making and profitable trading. Additionally, providing history of prices which aids in knowing the currency's future price along with trading volume and momentum.
c) Illustrate how to add indicators on the chart and also how to configure them. (Screenshot needed).
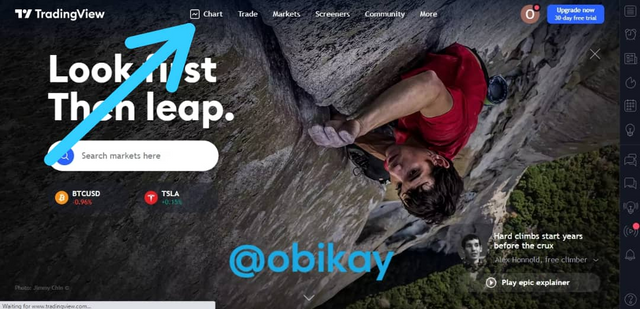
- I opened my browser and typed tradingview.com. When it opened up. I selected charts as shown
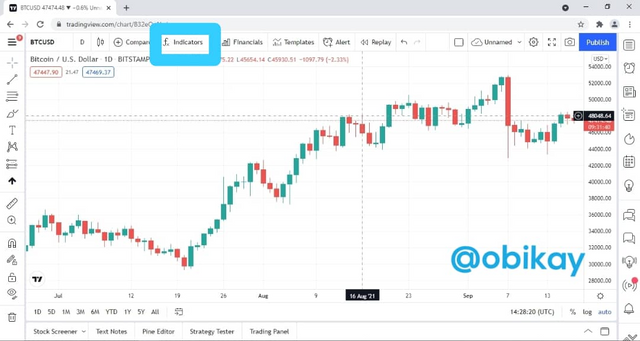
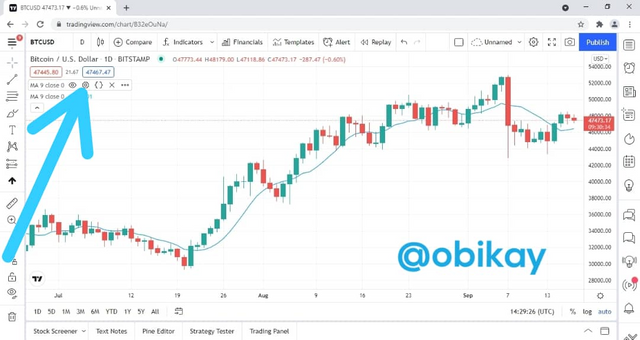
- It brings up the chart screen and I selected Indicators
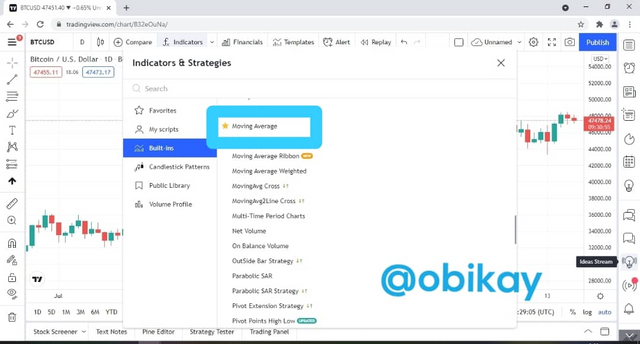
- And it displayed a list of Indicators for me ranging from A-Z. So I selected moving average.
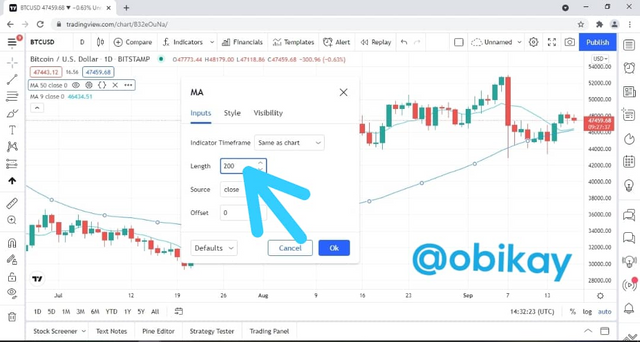
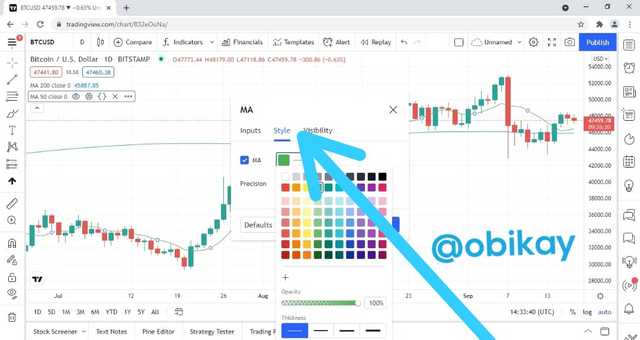
- And my Indicator was added, so I went further to configure it by selecting settings by clicking on the Indicator at the top left corner of the screen.
- So I will be taking my Long MA to be 200 with the colour blue.
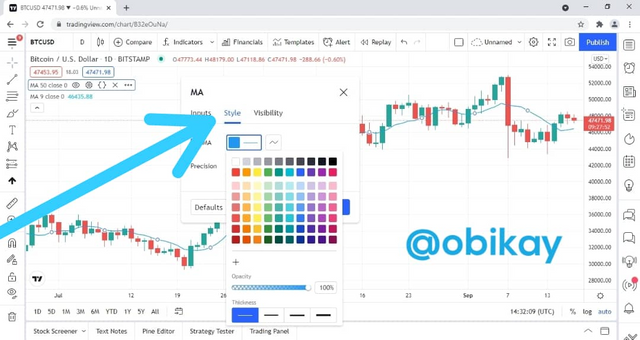
- And the short = 50 MA with the colour green
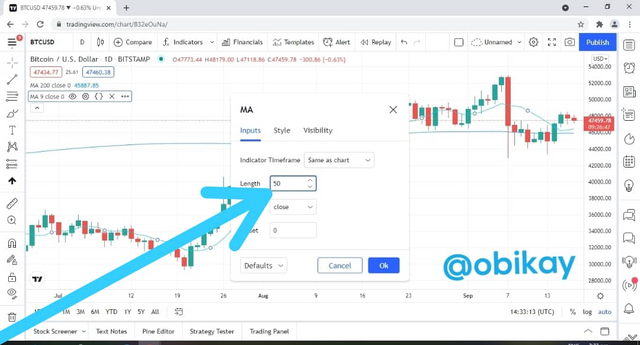
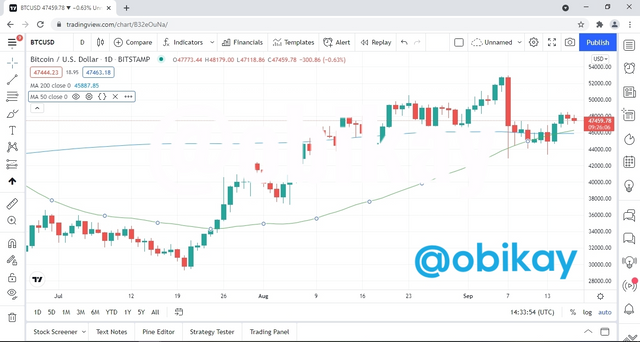
- And this is how my Indicator was added and looks like now.
2. a) Explain the different categories of Technical indicators and give an example of each category. Also, show the indicators used as an example on your chart. (Screenshot needed).
Trend indicators
Trend Indicators will aid you dictate the general direction of the trend and your been capable of recognizing trending market conditions. They are established on some form of an average value of the price and are helpful because you have the chances of trading in the trending direction.
Some trend Indicators are:
- Ichimoku Kinko Hyo
- Simple and exponential moving averages
- Moving average
- Triple exponential average
- Average directional index
Moving averages
Moving averages are possibly the best of indicators, its direction can be of help in recognizing trends. Using several moving averages together can aid in recognizing long, medium and short trends.
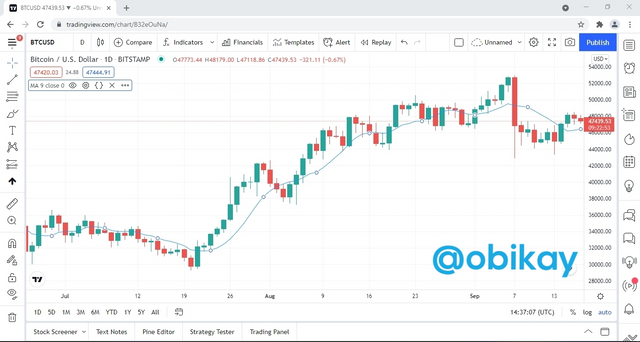 MA Indicator: BTCUSD
Momentum indicators
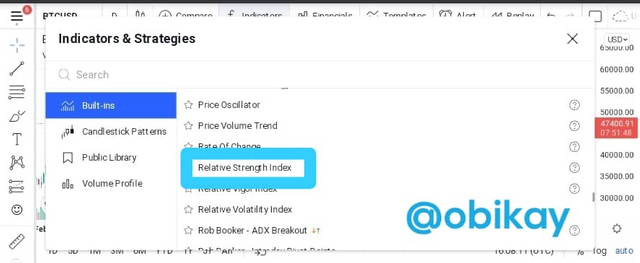
These are technical indicators that recognize the speed of price motion. They can also be called oscillators. They assist in providing tips so the trader will know when an asset price is oversold or overbought. Some momentum indicators are:
- Relative strength index
- MACD
- Average directional index
- Stochastic Oscillator
- Commodity Channel Index (CCI)
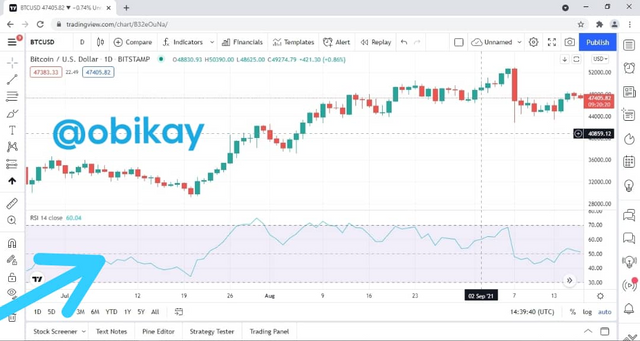
RSI indicator on chart: BTCUSD
Volatility Indicators
These are technical indicators that calculates the rate of price movement, notwithstanding the direction. The Indicator is used by traders to know the market's volatility if is high or low.
Some volatility indicators are:
- Average directional movement
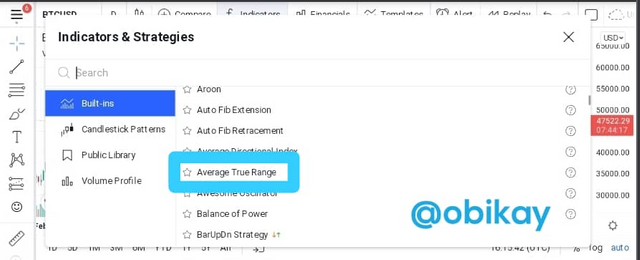
- Average true range
- Bollinger bands
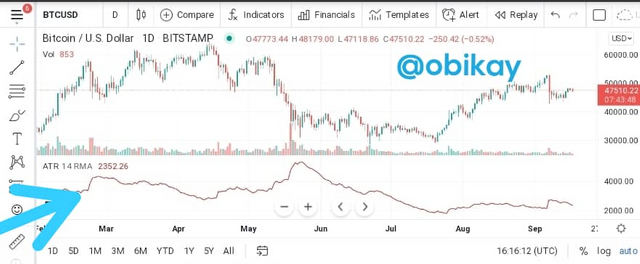
ATR indicator on chart: BTCUSD
Volume Indicators
These technical indicators calculate the strength of a trend formed on the volume of shares that was traded.
Some volume Indicators are;
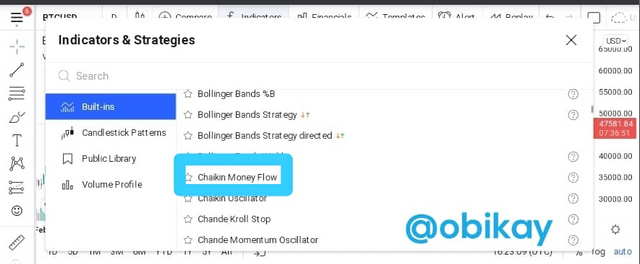
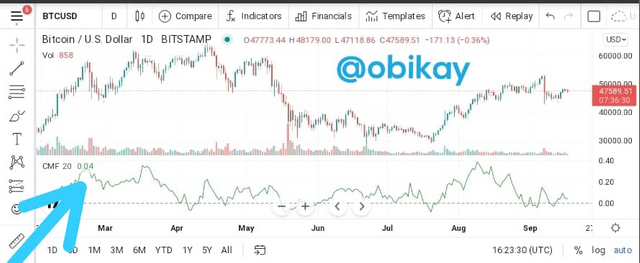
- Chaikin Money Flow indicator (CFM)
- Price Volume Trend indicator (PVT)
- Accumulation/Distribution index
CFM Indicator on chart: BTCUSD
b) Briefly explain the reason why indicators are not advisable to be used as a standalone tool for technical analysis.
Indicators are not advisable to be used as standalone tool in the sense that the trader might experience no t very good signals and also these might make such trader to make wrong decisions. Therefore, it is advisable for traders to not only use them but also combine them with some other technical tools. If properly combined can help reduce the risk.
c) Explain how an investor can increase the success rate of a technical indicator signal.
In other for an investor to increase the success rate, the trader must first have the knowledge on how to apply these Indicators properly because they possess different functions.
Also, it can be increased if a trader can put in use two separate Indicators coming from one group of Indicators at least this will help the trader to acquire good signals and profitable accomplishment of trades.
Conclusion
Technical indicators are useful in many ways; to analyze markets, develop trading strategies, and confirm trading signals. However, they are usually used in coexistence with price action.
Thank you professor @reminiscence01 for the lecture.
Hello @obikay, I’m glad you participated in the 2nd week Season 4 of the Beginner’s class at the Steemit Crypto Academy. Your grades in this task are as follows:
Recommendation / Feedback:
Thank you for completing your homework task.
Goodday sir,
This is the 5th day and my assignment has not been curated
Cc:
@sapwood
@steemcurator02
It will be taken care of. Exercise patience with the team.
Thank you professor
Thank you professor