Steemit Crypto Academy Season 4 - Beginners' course - Homework post for Task 10 : [Candlestick Patterns] by @obikay

background
b) In your own words, explain why the Japanese Candlestick chart is the most used in the financial market.
c) Describe a bullish and a bearish candle. Also, explain its anatomy. (Original screenshot required)

Explain the Japanese candlestick chart? (Original screenshot required).
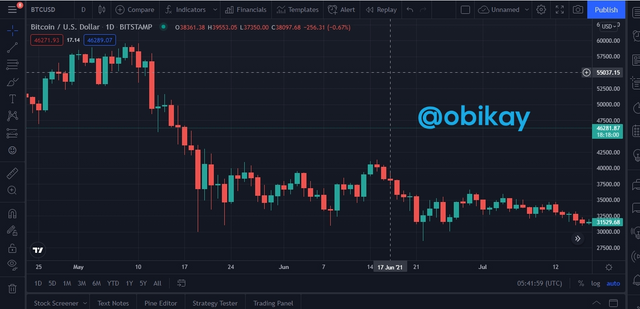
Candlestick chart was developed in the 1700s by a Japanese trader named Homma Munehisa, the charts provided him and some others with an overview of the market high, low, open and close prices over a period of time.
This kind of chart is used as a buying and selling tool to visualize and examine the price actions overtime for derivatives, currencies, stocks, commodities, etc. Although the symbols utilized in Candlestick Charts looks like a Box Plot, but they have different functions.
Candlestick Charts show a couple of bits of price statistics including the near price, open price, lowest price maximum price.
Each symbol stands for the trading activity compressed over a period of time like one minute, hour, day, month.
The rectangle of the symbol is called real body, and it is used for showing the scale between the open/close price for that period.
Whereas the lines running from the bottom and top of the body are actually called the lower and upper shadows or called wicks. Each shadow stands for the highest or lowest price traded traded during the specified period.
With the market in it's bullish state the closing price will be higher than when it opened, then colour is usually white or green but can as well be customize according to the trader. But with the market in a bearish state, the closing will be lower than the open, the colour might be red or black.
In your own words, explain why the Japanese Candlestick chart is the most used in the financial market.
source
Candlestick charts are great for identifying and prediction of trends in market, and are also useful for interpretation of market sentiment on a daily by the color and shape of each candlestick symbol.
For instance, with a longer body, the stronger the buying or selling pressure, while a very short body indicates small price movement during this period and represents consolidation.
Candlestick charts help to disclose market mindset that is the fear and greed of sellers and buyers through various indicators like the color and shape, however additionally via the various recognized patterns that may be discovered in Candlestick Charts.
These candlestick charting patterns are useful for displaying price relations and can be used to predict possible future market movement by the trader.
Describe a bullish and a bearish candle. Also, explain its anatomy. (Original screenshot required)
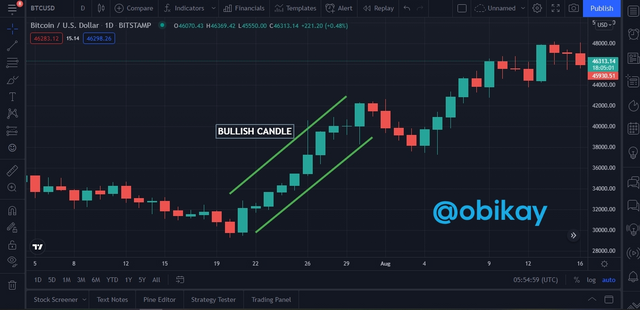
This candlestick is visible every time the price of the specified cryptocurrency moves, when their is an increase in movement, its an up-trend sending the market a great signal for traders to act.
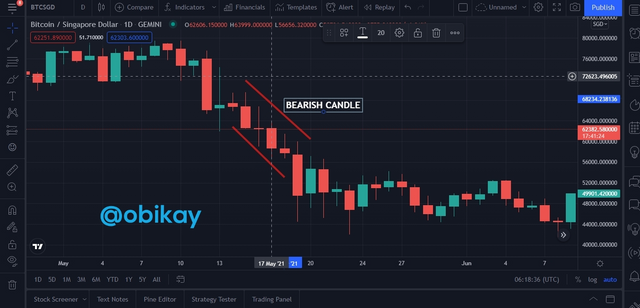
This candlestick indicates a decline in an asset price. Most of the time, this happens often, sending a bad signal to the market, due to when an asset is sold below the opening price, the trend will lower the price.
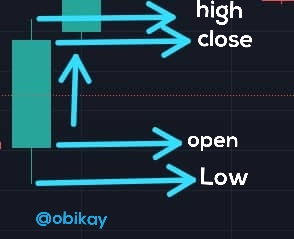 BULLISH
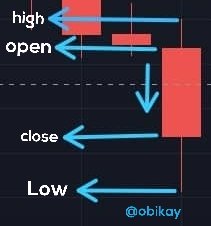 BEARISH
| parts | bullish and bearish |
|---|---|
| High | Refers to the highest price that has been sold on an asset in a specific period of time. |
| Close | Closing rate of an asset at a particular point in time. |
| Open | The starting price of a coin at a given time. |
| Low | Low price or rate for an asset for a specific period or time. |
Conclusion
Candlestick charts which is a good analytic tool can provide great intuition into the market sentiment, and it also assist a trader in the decision making of price movements.
Thank you professor @reminiscence01 for the lecture.