"Perfect Entry" Strategy using Stochastic Oscillator + 200 Simple Moving Average - CryptoAcademy - Dynamic Beginner Course - S5W3

Welcome to my homework task, in the past weeks, we have discussed topics such as Price Action and Harmony in great details. Continuing in this week, we are going to look at an interesting and practical strategy that we can utilise as beginner traders to make profitable trades. I will implore us to pay maximum attention to this presentation, as it explains in details all we need to know about the PERFECT ENTRY STRATEGY.
All trade screenshots were gotten from my tradingview.com platform
QUESTION 1
SAY IN YOUR OWN WORDS THAT YOU UNDERSTAND ABOUT THE PERFECT ENTRY STRATEGY (PLACE AT LEAST 2 EXAMPLES IN CRYPTO ASSETS)?
The perfect entry strategy is a dynamic strategy because, the core concept behind its formation is based off the ideas of “Price Action”, “Market Structure” and “Harmony” which professor @lenonmc21 has done great justice to with his in depth explanation in our past sessions. The perfect entry strategy incorporates the 200 Simple Moving Average and the Stochastic Oscillator indicators to detect where the strength of the market lies, we then use Japanese candlestick formation to determine our entry point. The perfect entry strategy can help us to catch new trends just as they are forming, and also has a great risk to reward with each trade setups, this is possible because the perfect entry strategy usually catches the trade, right when the market is about to turn, so we can afford to have a tight stop loss size while enjoying a large market move. In trading the perfect entry strategy, we should understand that the strategy is made up of three technical analysis tools, these tools serves as the components of the strategy. Therefore I will explain to us what these components are and how they function
COMPONENTS OF THE PERFECT ENTRY STRATEGY
The perfect entry strategy is made up of three basic tools, which are combined together to form this powerful trading strategy, understanding these components and how they function can help us to effectively combine them together and use the perfect entry strategy in a very profitable manner.
200-PERIOD MOVING AVERAGE: the first components of the perfect entry strategy is the well-known moving average indicator, the moving average indicator helps us to know the current market structure and the trend direction we should be trading towards. The moving average efficiency in determining the current trend we should trade in, can be improved if we utilise our knowledge of price action alongside. However, when we want to utilise the moving average as part of the perfect entry strategy, we have to set the period to 200, only the moving average set to a 200-period can be used for our perfect entry strategy. In the perfect entry strategy, when price is trading below the 200-period moving average this shows to us that the current trend is bearish, and as such any trade we are going to be placing must be a sell order in the direction of the current bearish trend. We can also use price action as a confluence to confirm the bearish trend, by identifying if price is making lower highs and lower lows. In a bullish scenario, price must be found trading above the moving average to confirm to us the presence of the bulls in the market, while we can also use our price action knowledge to identify if the market is creating higher highs and higher lows. Indeed, the 200-period moving average is an important component of the perfect entry strategy.
STOCHASTIC OSCILLATOR: The stochastic oscillator is a technical analysis indicator that helps us to identify when the market is in an area of strength or weakness, it does this by identifying the “oversold” and “overbought” zones of the market. The overbought zone is usually the 80-100 upper area of the indicator, while the oversold zone is the 20-0 lower area of the indicator. When the market trades to the overbought zone of the stochastic oscillator, it means the buyers have pushed price too far and as such the market is ripe for a reversal to the downside, therefore sellers have to step in to drive the market back to lower prices, alternatively when the market is in the oversold zone it means the bears have greatly pushed price down and the buyers have to come in to move price up, as such the market will experience a retracement and the price will move up. In a bearish trade setup, when the market is bearish and trading below the 200-period moving average, the stochastic oscillator must also be trading in the overbought region of 80-100, this will confirm to us that the market has been priced into a premium range and as such sellers are willing to enter the market and move price lower. Meanwhile, in a bullish trade setup, when the market is bullish and trading above the 200-period moving average our stochastic indicator must also be trading in the oversold region of 20-0, this will serve as a confirmation that the market is in deep discount levels and buyers are eager to jump into the market to move price up. The stochastic oscillator is therefore also a very crucial component of the perfect entry strategy we are talking about.
JAPANESE CANDLESTICK PATTERN: As I stated in the earlier part of my presentation, the perfect entry strategy also makes use of certain “Price Action” knowledge it does this by utilising a certain type of Japanese candlestick pattern. As we have been taught in our previous classes by professor @lenonmc21, a major component of Price Action are the formation of different candlestick patterns, and these candlestick patterns can be used to generate profitable entry signals on the price charts. In generating a trade entry with the perfect entry strategy, we look out for the Japanese candlestick pattern to form when price is trading towards the 200-period moving average indicator, the candlestick pattern must form when price trades a little bit through or exactly at the moving average line. The candlestick pattern that must form, must be a small candle with a little open –close body and should have wicks at both sides, the presence of this candlestick pattern forming at the 200-period moving average line, tells us that although the market traded in a counter direction, the market is actually weak and cannot sustain its current movement therefore, a reversal is about to occur. When we are trading the perfect entry strategy, the Japanese candle stick formation is the confirmation we need to occur before we put in our trade so as to catch the new trend as it unfolds. This particular Japanese candlestick pattern will be discussed in details in question 2 so that we will be able to easily identify it in the market at all times.
Having explained the three basic components of our perfect entry strategy, with the aid of chart screenshots, I will now show us trade examples of the perfect entry strategy that played out in the Cryptocurrency market.
EXAMPLE 1
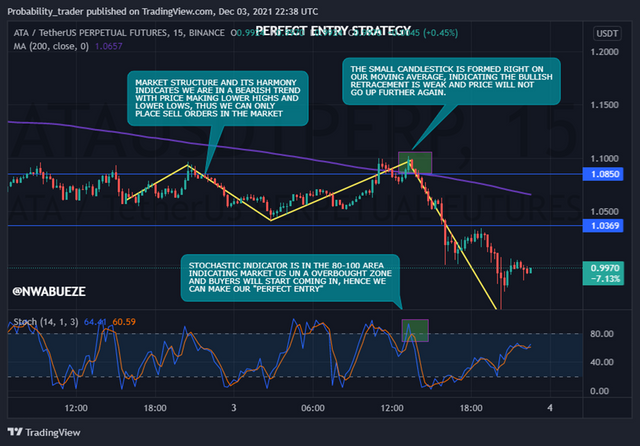
In the chart screenshot of $ADAUSDT above, we can observe how the perfect entry strategy played out nicely in this bearish scenario. Price traded below the 200-period moving average to indicate bearishness to us, this was also confirmed by our knowledge of market structure where price was making lower highs and lower lows. Also, the stochastic oscillator was in the overbought region of 80-100, indicating to us that the market is about to reverse and start selling. Then the Japanese candlestick pattern occurred with the candle that traded into the moving average and has its wick pointing in either direction, with the presence of these confluences the stage was set for us to place our perfect entry trade, after which we could see price selling till the stochastic oscillator traded to the oversold region.
EXAMPLE 2
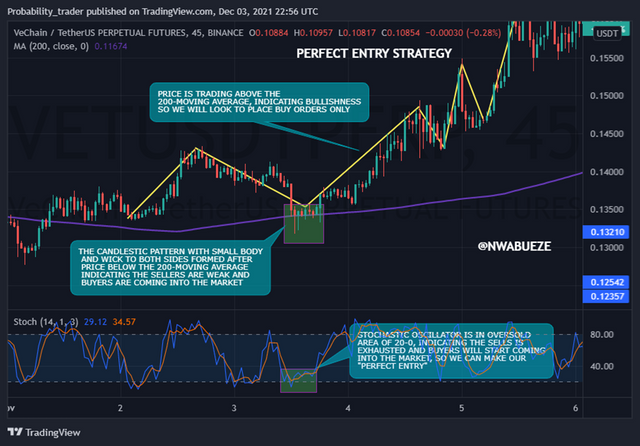
We are going to look at a bullish trade example this time around, in the $VETUSDT chart above, price was trading above the 200-period moving average and this indicates bullishness to us, as such we are only allowed to place buy orders in the direction of the bullish trend. The stochastic oscillator was also in the 20-0 area, telling us that the initial bearish retracement has lost its steam and buyers can start coming into the market and we can place our perfect buy entry. Finally, the candlestick pattern formed with a small body and wicks pointing in both sides, the presence of these, presented us with a perfect entry to join the buy side. Worthy of note is that immediately the perfect entry strategy presented itself in the market, price started buying, this is what makes the perfect entry strategy “perfect”, because if we properly identify it, the market will move dynamically in our speculated direction.
Trading the perfect entry strategy has some benefits for the trader, some of which are listed below
• Perfect entry strategy is a beginner friendly strategy, because it is made up of few components and they are easy to identify on the chart
• Perfect entry strategy allows us to catch the beginning of a trend movement, which can greatly increase the trade reward
• Perfect entry strategy has a low entry risk and a good reward to risk ratio, due to the fact that we get to catch the trend early, this serves to greatly reduce our stop loss distance and also increase our risk to reward ratio, which could range from 1-3. To 1-4 or in some cases more
QUESTION 2
EXPLAIN IN YOUR OWN WORDS WHAT CANDLESTICK PATTERN WE SHOULD EXPECT TO EXECUTE A MARKET ENTRY USING THE PERFECT ENTRY STRATEGY.
In trading the perfect entry strategy, we are required to wait for a certain type of candlestick pattern to form before we can place a trade entry. In the session I will explain to us what the candlestick patterns is, how it forms and how we can easily identify it in price action. Kindly pay rapt attention as we enjoy the flow.
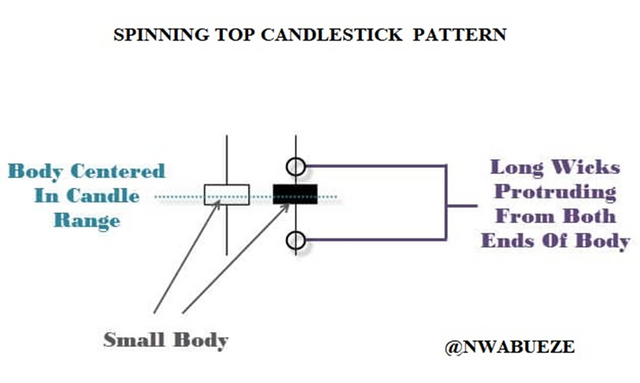
The perfect entry strategy utilises a blend of simple yet powerful indicators and certain Price Action formation, one of which is the Japanese candlestick pattern we are going to discuss about, when price trades into the 200-period moving average we have to wait for price to form a candlestick pattern that gives us the go ahead to place the trade, this candlestick pattern is formed in such a way that the body is small, and then the wick protrudes from either side, in classic candlestick formation, this pattern is called the “spinning top” candle. The spinning top candle forms at key points of the market, and represents indecision of the market and also a potential reversal in the market, therefore spinning tops are usually considered reversal candlestick pattern and rightly so. The candle usually has a small open-close body and long wicks in both sides, the small body and long wicks shows us the intense battle between the bulls and the bears in which neither were able to force the market in their direction, thus leading to a form of indecision about the next price direction. However, this indecision usually leads to a reversal, because one the initial trend market participants would have exhausted their volume in fighting off the new market participants and there would be little volume left to continue to push price in their direction, therefore the fresh market participant can easily assume control and reverse price to a new direction.
The image below shows us how a spinning top candlestick forms, with a small body and protruding wicks from both end.
Now that we have seen the candlestick pattern we use in executing the perfect entry strategy is actually a spinning top candle, we have to be on the look-out for this kind of candle formation whenever we are trading the perfect entry strategy, especially when price trades through our 200-period moving average, because the spinning top tends to form in the area as it indicates the weakness of the initial trend participants and it shows us that fresh participants have entered the market and they are willing to reverse price to the other direction.
Below is another image of the spinning top chart pattern we are to use in executing our trade
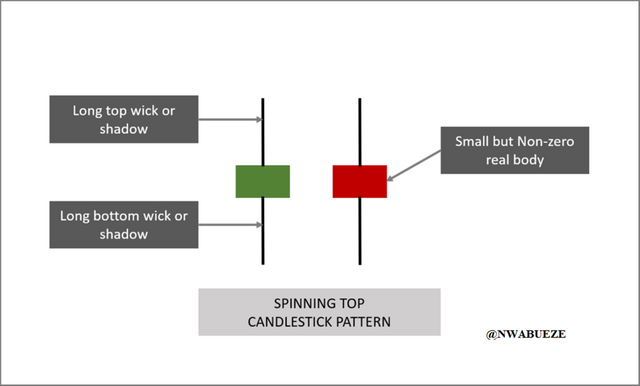
The formation of the spinning top candle stick pattern is a very important part of the perfect entry strategy, therefore it is very important for us to be able to properly identify the candlestick pattern when it forms. Also, we are not just to trade every spinning top candle that forms on the market, but specifically it must form when price trades through the 200-period moving average and also when our stochastic oscillator is in the oversold or overbought area.
QUESTION 3
EXPLAIN THE TRADING ENTRY AND EXIT CRITERIA FOR BUY AND SELL POSITIONS IN ANY CRYPTOCURRENCY OF YOUR CHOICE (SHARE SCREENSHOTS OF YOUR OWN)
In this homework task so far, I have explained to us what the perfect entry strategy is, how it works and how we can identify it in when trading, also in the second question I explained and described to us the Japanese candlestick pattern that is incorporated into the perfect entry strategy and how we can properly identify it and trade it also. We will continue into the next question where I will explain to us the trading criteria that needs to be fulfilled in the market before we can place our entry and exit positions in the market place
In trading the perfect entry strategy it is important that we lay down well defined rules and structure that will act as a guide for us in the market, so that we can properly identify and execute flawlessly the perfect entry strategy. The perfect entry strategy can be used to trade both bullish and bearish market conditions, therefore I will be explaining the various criteria the market has to fulfil when we want to place buying or selling position, so that we can trade ‘perfectly’ the perfect trade entry strategy.
BUY POSITION:
When we want to enter and exit a buy position in the market, certain criteria must be in place, and we must endeavour to be disciplined enough to follow these trading rules to the letter, so that we can enjoy to the maximum the profitable trades that the perfect entry strategy has to offer us.
ENTRY CRITERIA:
• MARKET STRUCTURE; when we are attempting to place a buy position using the perfect entry strategy, the current market structure must be bullish, we can identify the current market structure by using our 200-period moving average tool, when we look at the chart, price must have been trading above the moving average, and using the moving average as a support line that price dips towards and bounces from to continue the bullish trend. When this happens it indicates to us that the market is in a stable bullish trend because it is trading above the support line of the moving average and each time price dips towards the moving average line, it trades through it briefly and then immediately resumes the bullish trend. Also, the bullish market structure can be further confirmed with our knowledge of Price Action, in a bullish trend, price should be creating higher lows then followed by higher highs which takes price to further levels. Thus the market structure can be determined efficiently by harmonising the moving average and price action movement that is, to confirm we are in a bullish trend price should be trading above the moving average and at the same making higher highs and higher lows. This confluence will minimise the risk of us trading against the major trend and reduce our susceptibility to making trading errors.
• OVERSOLD: after determining the current market structure, the next step will be to look at the stochastic oscillator. In placing a buy position the stochastic oscillator need to have traded into the 80-0 area below, otherwise known as the oversold zone. When price trades into the oversold zone this indicates to us that the initial sellers that are behind the short term retracement of price into the moving average line, have pushed price to a state of deep discount and as such the bulls can come into the market at a cheaper price to push price higher. The overbought area of the stochastic oscillator is the zone where we begin to look for buys, so that we can catch the new trend early and exactly when the market reverses, this will also help to trade in the direction of least resistance from the market. We must always lookout for the stochastic oscillator to be in the oversold area must when looking to place a buy position in the market
• JAPANESE CANDLESTICK PATTERN: the final condition that must be met when are looking at placing a buy position is the formation of a particular candlestick pattern. I have earlier explained that the Japanese candlestick pattern we are to lookout for is the SPINNING TOP candlestick pattern, the formation of this pattern serves as our trigger for the entry. However, we do not just blindly trade every spinning top pattern that is on the chart, but specifically we should only utilise the spinning top that forms when price trades through the 200-period moving average and when it forms around the moving average. The occurrence of this candlestick pattern is the trigger that we require to place our buy entry in the market.
• STOPLOSS: after we have identified where to place our buy stops it is important for us to observe proper risk management by defining and setting our stop loss for the perfect entry strategy, our stop loss should be placed at the high of the spinning top candlestick pattern that triggered our buy entry. The top of the spinning top would serve as the beginning of the bullish trend and any violation of that level by price means the trade is not going to play out as planned, it is therefore better to be stopped out at this level and endure a small loss that trade without proper risk management and endure an account wrecking loss. Alternatively, we could also use price action to determine where our stop loss should be placed, in a bullish trend price would be making higher highs and higher lows, we can therefore place our stop loss at the most recently formed low in the market, as this would serve as a short term support level that the price has just bounced off. The perfect entry strategy is a risk friendly strategy as it allows us to place relatively small stop loss when entering our buy position thereby limiting our risk exposure.
• TAKE PROFIT: after placing our buy position and applying risk management by placing a protective stop loss at the recently formed price low, our attention will now shift to exiting the market with a profit. Our take profit can be using the stochastic oscillator, when it trades into the overbought region, as this will inform us that the buyers have pushed price too high and as such the market might be retracing anytime soon, therefore we can exit at this level and walk away with our profits. Usually exiting at the overbought region can give us a nice risk to reward of 1-3, 1-4 and at times even more. Indeed the perfect entry strategy is a very profitable strategy to trade in the crypto market.
SELL POSITION:
Having explained the criteria we are to use when placing a buy position using the perfect entry strategy, we will now look at the requirements for placing a sell position in the market, the criteria for sell position is basically the same as for the buy position explained above, however certain criteria must occur in the opposite direction, I will explain them below.
ENTRY CRITERIA:
• MARKET STRUCTURE; in placing a sell position in the market, the market structure must be in a bearish form, we can easily identify this when the market is trading below our 200-period moving average. This tells us that the bears have successfully driven price to a weak point. Also, we can confluence this with our knowledge of price action where we can identify if the price is bearish, when the market is making series of lower highs and lower lows. Therefore when price is trading below the moving average line and also making lower highs and lower lows is the best time for us to begin to consider placing our sell position in the market.
• OVERBOUGHT: after we have identified the bearish market structure, the next thing is to identify where the stochastic oscillator is currently trading in. for a sell position, the stochastic oscillator must be trading in the 80-100 area which is the oversold area. When the oscillator in in the oversold zone, it indicates to us that the current bullish retracement is has been overdone and sellers can now resume shorting the market to lower prices.
• JAPANESE CANDLESTICK PATTERN: in placing a sell position we also need to look out for the formation of the candlestick pattern also called ‘‘spinning top’’. This pattern acts as the trigger and confirmation we need to the market to present to us before we execute our sell ideas. The spinning top pattern must form when price trades through the moving average line or around it.
• STOPLOSS: in placing the stop loss for a sell position, we utilise our knowledge of market structure, to place the stop loss right at the high of the spinning top candlestick pattern or conservatively we can place it at the most recent high that formed.
• TAKE PROFIT: we should look to take our profit when price trades to the oversold region of the stochastic oscillator, usually this will offer us an impressive risk to reward return of 1-3, 1-4 and in some cases we might be able to squeeze more out of the market.
ADDITIONAL TIPS: I will be giving us few additional tips that we can utilise when we are trading the perfect entry strategy, these tips will guide and protect us against making costly trading errors that can lead to losses. They are listed below
• Do not trade if price is in a range; we have to be diligent enough to properly identify the type of market structure we are in, so that we do not trade in unfavourable ones, when the market is not moving in any definite direction, it is better to wait and not trade, because the perfect trade entry strategy works best when employed in a trending market condition.
• Price action trend should tally with MA direction bias; also we must make sure that in determining our trend direction, our price action must tally with the information the 200-period moving average is telling us. That is, if price action is indicating bullishness by making higher highs and higher lows, then our moving average must also be indicating bullishness with price trading above it. Waiting for this confluence will further strengthen our bias for taking the trade and we will end up with more profitable trades when trading the perfect entry strategy.
CONCLUSION
In this session, I learnt about a powerful trading strategy cannel the perfect entry strategy, I learnt about its components and how they are combined together to become a powerful strategy.
I look forward to employing the perfect entry strategy in my trading system hence, special thanks to professor @lenonmc21 for teaching us such powerful trading tool, I earnestly look forward to the next session.