[Trading strategy with RSI and ICHIMOKU]- Steemit Crypto Academy- Homework post for Professor @abdu.navi03
.jpg)


The crypto market is largely unstable with unpredictable prices. Traders keep tabs on the recent developments in order to make better trading decisions, while using indicators, tools and strategies to confirm their predictions.
Technical analysis is best used to predict market price movements. You can use various indicators, including ICHIMOKU CLOUD, RSI, and MA to find the best points to enter and exit the market.
Technical indicators are often not used alone and each have their own significant flaws, which is why it is necessary to combine them in order to get the most accurate results. The homework post will explain a trading strategy that combines the RSI, ICHIMOKU CLOUD, and confluence of three other indicators in order to provide higher rates of accuracy.
The momentum based indicator, the RSI, is very popular in the world of crypto trading. The traders use it to analyze the market. It is a powerful and useful indicator that many traders use to see if the market is in an oversold, overbought, or turning point
Trading strategy based on RSI with ICHIMOKU Cloud can be a tool for determining your best market entering point, as well as your best selling point. The indicator oscillates in 100 levels and oscillates below the 30-mark when in oversold state and the market is in bearish trend. likewise oscillates above the 70-mark when in overbought state and the market is in bullish trend.
When the RSI moves above the 70 level, it indicates that the market is in an overbought zone and a lot of buying pressure exists. The market price is increasing and is currently in a bullish trend. The bearish trend is expected at this point, so possibly might reverse to sell
This strategy works well in trending markets. However, it cannot be utilized in range market conditions.
The Ichimoku indicator helps identify the resistance and support zones and is a helpful indicator to identify it while the prices are moving. The signals received from the Ichimoku indicators are most times lagging.
A powerful and beneficial trading strategy is formed when combining RSI with the Ichimoku Cloud. The Ichimoku Cloud indicator is best to determine the market trend, while RSI provides a powerful way to identify market volatility zones; over-bought or over-sold.
Combining the ICHIMOKU CLOUD with RSI, we get an effective and efficient trading strategy with around 80% accuracy. This strategy also provides us with early signals, allowing us to take positions before trends start.


While RSI can be a good indicator for trending markets, it does not work well in ranging markets. Some range markets may seem to have no clear trend, but often these range will only last a short period of time before the market moves back into a more clear trend. The danger with using RSI during ranging market periods is that they may continue to operate alongside the current trend and lead you astray by misleading you on a different note from the actual market
There are some things the RSI cannot provide, such as volume information. The second false point of this indicator is that this indicator cannot give traders confirmation that their trade has been executed. It doesn't work best either when traders use it along with other tools.
In addition to that, traders need to use an indicator as a confirmation when RSI is above 70 and exit the trade when it falls below 30. This trading strategy needs to be used with caution because of which, traders will gain the accurate and reliable results. in other words, the RSI is not suitable alone
The RSI in trading strategies can sometimes be difficult to identify when indicating a trend reversal. If there exists continuous buying pressure and the buyers are controlling the market, a trader may be in an overbought state of the RSI. They would intuitively be skeptical of momentary dips, because those are supposed to lead to a reversal. However, it is not always true. The trend does not always reverse. look at the image below

One bad part about the Ichimoku cloud is that the Ichimoku indicator is that it's the lagging indicator, so its signals come too late. It lag behind the assets price.
We cannot make trades early because of the lack of available information in the market. Inaccuracies may make it hard to identify a buy or sell point, as traders may enter at peak times and lose out on gains they could have had. Keeping an eye out for rank signals like ichimoku clouds can help by giving buy or sell alerts earlier.
This trading strategy uses historical data to predict the future. But this may happen that history don’t repeat itself. In a market where the price are highly liquidated, this trading strategy can produce false signals to traders as it is unable to determine top resistance and bottom support levels appropriately.
using this indicator alone may provide inaccurate data and traders could suffer as a result.


Here we will be using the RSI + ICHIMOKU CLOUD to determine the bullish and bearish trend.
BULLISH TREND
when the buying pressure set to increase, which increases the demand and decrease supply at an equal pace.but it is important to note that the prices are not likely to fall below the previous low, so we experience a rise in the movement of the asset.
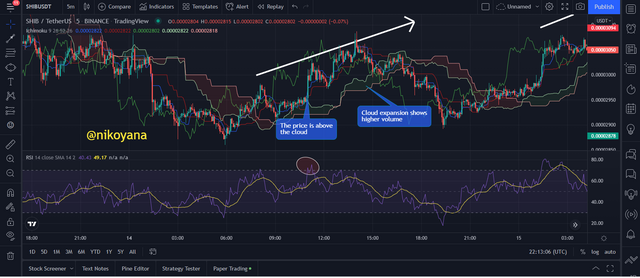
The RSI is currently at 70, which means the market is in an overbought condition. confirming the market in a bullish position. the price is being pushed upward. The first high is higher than the previous highs and there are many consecutive higher highs. You should initiate a long strategy.
If the RSI is above 70 and the price cross over the ichimoku cloud, this is said to be an uptrend. The volume of an uptrend can be determined by observing the expansion or contraction of the ichimoku clouds.
let's observe the image below
BEARISH TREND
when the selling pressure set to increase, which increases the supply and decrease demand at an equal pace. but it is important to note that the prices are not likely to rise above the previous high, so we experience a fall in the movement of the asset.
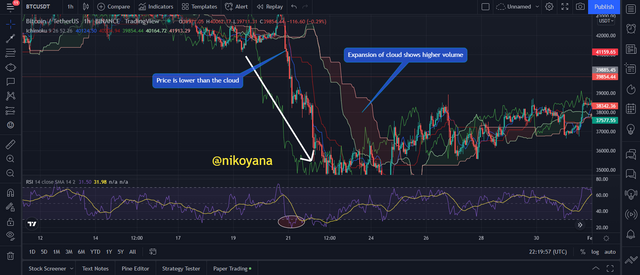
The RSI is currently below 30, which means the market is in an oversold condition. confirming the market in a bearish position. the price is being pushed downwards. The first low is lower than the previous lows and there are many consecutive lower lows. You should initiate a short trade.
If the RSI is below 30 and the price cross below the ichimoku cloud, this is said to be a downtrend. The volume of an uptrend can be determined by observing the expansion or contraction of the ichimoku clouds.
let's observe the image below


The Moving Average is the technical indicator used to study the market and predict future trends. This indicator has only one oscillation line and can be very easy to use. When the price moves above the MA, it is a sign of a bullish trend. Also when the price goes below the line it's in for a bearish trend.
When trend direction on the RSI indicator flips below the line, a trader may be in for or about to enter a declining market. The ICHIMOKU CLOUD is an indicator that can help traders adjust their trading accordingly.
A combination of the Moving Average indicator and the RSI+Ichimoku trading strategy can help filter out false signals. This combination will also offer a more authentic, accurate trading signal.
Choosing the right period for a Moving average depends on the trading strategy. When using the moving average as an indicator, they best set their periods to match. Using a high setting with Trading Strategy RSI + ICHIMOKU CLOUD is advisable because there is also high periods in the Ichimoku Cloud indicator.
In the trading strategy we've studied this week, we used a moving average period of 85 and combined it with RSI+Ichimoku Cloud.
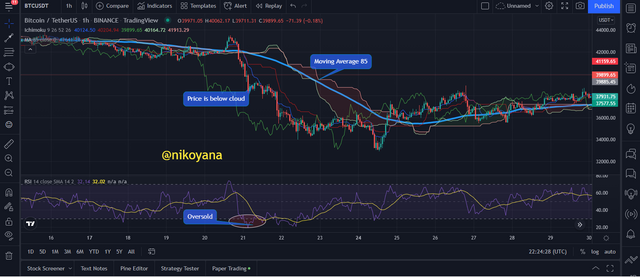
In the BTC/USDT chart above on a 1hr time frame, we explored a trading strategy best applied during downtrends: RSI below 30, moving price below 85 period MA and Ichimoku.


Here we will be looking at the support and resistance of this strategy on a ranging market and on a trending market.
TRENDING MARKET
The Ichimoku strategy is used to identify support and resistance levels in trending markets based on the ichimoku cloud indicator. In a strong uptrend, the support level is located at the bottom of the cloud as captured on the chart.
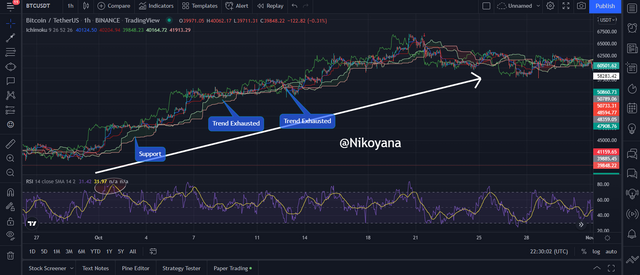
When the market is trending downward, the ichimoku cloud helps to identify resistance levels. with the price below the Ichimoku on a bearish trend this indicates where there is heightened resistance and is a level for possible entry into the sell market.
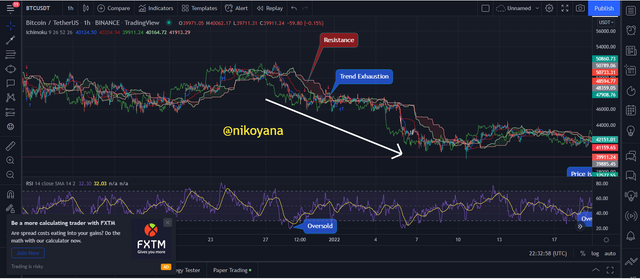
A trading strategy involving RSI and Ichimoku Cloud demonstrates the market trend with a weak trend when the price is near the ichimoku and a strong trend when it is far from it, with an indication of trend reversals.
RANGING MARKET
Trading Strategy is performance by RSI + Ichimoku Cloud. The ichimoku cloud cannot be used to produce more appropriate or accurate trading signals in ranging markets. You should use RSI to identify overbought and oversold conditions in ranges. RSI also produces the signals to measure momentum that can identify trend reversal points on the chart.
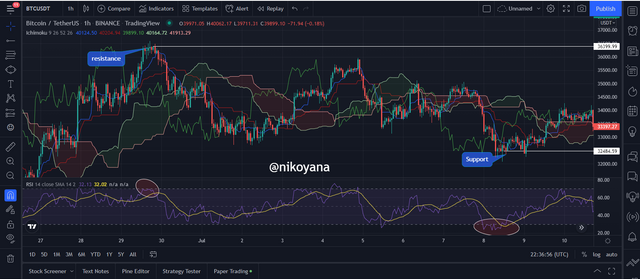
From the chart above we can see that the RSI was used to indicate areas of overbought and oversold in a ranging market


Intraday traders want to get quick benefits and profit from the price movement by trading crypto. Different strategies can be used depending on how traders use them- different strategies are effective for long term trading, or short term trading. Any strategy that suits a trader's needs is good for them - it's about making the most money doing what you know best.
In this lesson, we discussed trading strategy RSI + ICHIMOKU CLOUD which is very useful for intraday traders. In trending markets, this strategy lets you identify the market trend to capitalize on, or identify when to sell a spot and buy another as stock prices change. The strategy can also be applied in ranging markets by identifying what areas are overbought or oversold and that show future periods of strength or weakness. This can help identify the best trading opportunities and maximize.
New traders can make their first trades more effective and trade-worthy with a combination of the RSI + ICHIMOKU strategy. This way the trader will be able to enter trades at an optimal location, receive high profits and stay safe from risking any money. All indicators can be combined with one another in order to generate better insight when choosing an investment to make more accurate and complex strategies will keep traders away from riskier prospects.


Here we are required to open two demo trades for a buy and sell order respectively using the RSI + ICHIMOKU CLOUD strategy.
BUY ORDER
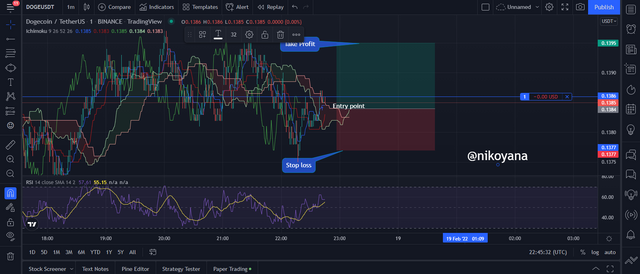
From the DOGE/USDT on a 1min time frame, we can see the RSI well above the 50 mark indicating a buy signal also the price breaks through the ichimoku cloud heading for a bullish trend having this indicators in confluence, I placed my stop loss and take profit at 1:2 risk reward ratio and placed my buy trade.
SELL ORDER
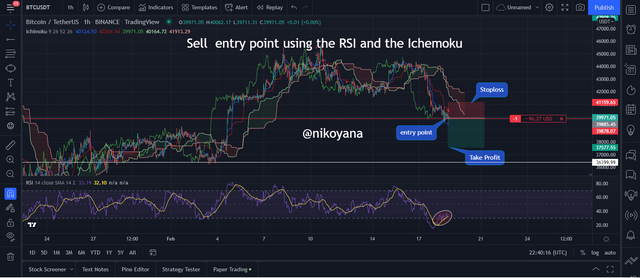
From the BTC/USDT on a 1hr time frame, we can see the RSI well below the 50 mark at an oversold region indicating a sell signal also the price breaks through the ichimoku cloud heading for a bearish trend having this indicators in confluence, I placed my stop loss and take profit at 1:2 risk reward ratio and placed my sell trade
Below is the result for both the buy and the sell trade respective confirming my initiated order


The trading strategy ichimoku+ RSI provides a clear signal for us to enter into the market or exit from the market. The Ichimoku cloud is best for determining the market next move, and a RSI (relative strength index) indicator is best at identifying the strength of the trend.
Using Trading Strategy RSI+ICHIMOKU CLOUD, you can increase the accuracy of your trade and receive on demand analytics.
This trading strategy is a great way to analyze graphs and charts, but it depends upon the trader's experience and capabilities that helped him or her utilize this trading strategy.
IMAGE REFERENCES : TRADINGVIEW
LOVELY REGARDS
@abdu.navi03