Support and Resistance Breakouts - Crypto Academy / S6W3 - Homework post for pelon53.
.jpg)

The first task is to explain the advantages of locating support and resistance levels in a chart before you trade. These are key levels that every trader needs to know how to identify on a chart. Knowing these levels will help traders with his analysis and positioning in the market.
Support are price points where buyers are likely to appear after a drop in price. They're treated as areas where traders show up after a considerable downside development, or sellers have exhausted their power. support are regarded as places where merchants "gathering" to take a huge buy on the asset.
Resistances are areas of prices where price is likely to reverse to the downside after a considerable rise in price. Resistances are zones where traders (sellers) are gathered taking sell position in the market.
There are three types of support and resistance, Static, slopy and Dynamic. Static is represented by horizontal lines in charts, while slopy is represented by a diagonal line across higher lows and lower highs and Dynamic is represented by moving average that move as an asset's price moves.
Support and resistance serve as entry and exit levels that tell when the market is about to enter a strong upward trend. Understanding these levels allows for your trades to be more successful.
Knowing the exact time to enter and exit the market is crucial. When you know when to exit the market, you save yourself from losing what profit you have made and your capital is protected. Knowing these two things will help you make as much money as possible. It's best to take profits before the trade changes in a way that goes against your prediction. Trends change so you can't be certain a price won’t return lower than it once was in an uptrend, or rise higher at some point so that an investment becomes unprofitable in an bearish trend.
With these supply and demand zones, when traders demand for a traded asset - or the supply of that asset rises compared to the demand - they are at risk of being higher prices within this zone. You would have come across support and resistance in elementary economics. When traders demand an asset, they might want to accumulate more of it in an effort to reduce their costs. The enhanced rising of the asset against their purchase price is referred to as a "support zone". and vice versa.
Resistance zones refer to a spot where the supply is overwhelming with pull and decrease of prices. When a price begins to approach resistance zones, buyers exit the market, and sellers are abundant.
Here, I am going to explain the analytic breakout of support and resistance shown with the help of screenshots
Support and resistance is an important concept for traders who buy and sell in the market. The price of an asset often fluctuates based on range, but when the market trends, it doesn't stay within a swinging range. This creates the spectrum 70% of time of a market ranges to only 30% that's trending.
The price moves up and down during trading at a certain range. When the price moves up, buyers are in control, and sellers take the lead when it falls. The upper end of the trading range, where sellers are resisting the price advance, is called resistance. And the support level is what supports the advance of the price during trading.
Support and resistance zones hold price for sometimes. When tested multiple times, however, these zones have weaknesses that make them more vulnerable. Breaking a support or resistance zone will change the temporary dynamic of the other and push it in a new direction like support becoming resistance and vice versa.
When resistance breaks and the price goes up, the resistance marker is powerful enough offset any future fall. Buyers push up and sellers couldn’t defend themselves because they are not in the zone at that time.
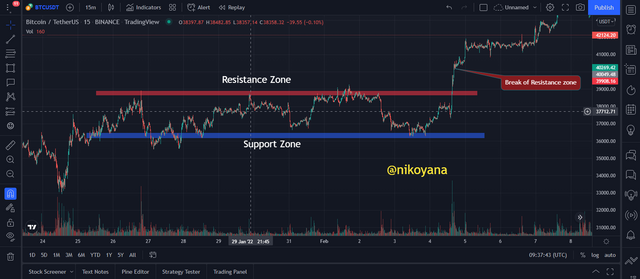
From the BTC/USDT chart, we can see that there was a little struggle between the support and the resistance before a breakout in the resistance zone showing that the buyers are having the upper hand after series of retest on the resistance.
To break resistance it’s important that traders see other tools, such as volume indicators, for filtering purposes. Volume is the key measure of supply and demand in the stock which can expose changes in trends. There are certain circumstances where a change in trend can be spotted before breaking the resistance, like when the volume on an upward slope rises and we enter a confirmed buy signal.
Consider that a breakout is valid if the volume increases when the price goes through this level. This signifies that the buyers are in control of the market and are willing to take prices to higher levels.
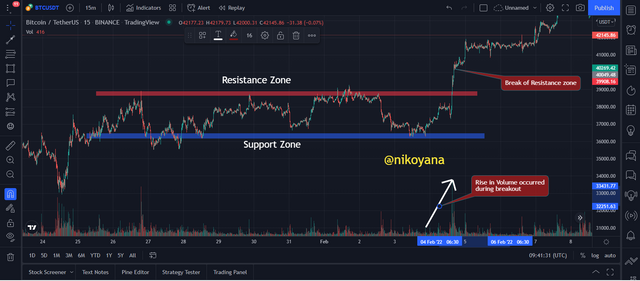
From the chart above we can clearly see the increase in volume that follows the break out showing the buyers are having the upper hand.
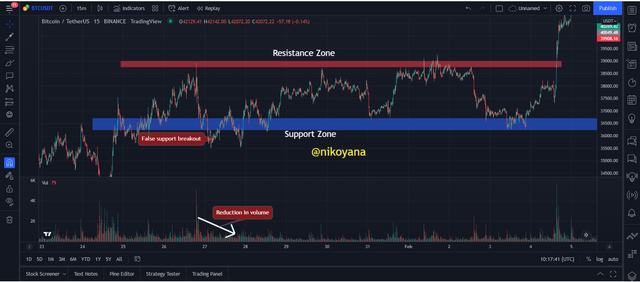
A support break occurs when the buyers are unable to increase the price at a support zone. This may be caused by the sellers being more aggressive. These types of breaks often weaken a zone because it commonly undergoes more tests after a break.
This implies that at the support zone, buyers were unable to push the price higher, and so the support was not able to support the price. This makes sense as it is logically easier for sellers to break through a well-defended price point than it is for buyers to break through a strongly defended one. A sell position could be opened when the price retests this zone, and stop loss could be placed above this zone; take-profit could also be at another support zone (should there be another approximately on another chart).
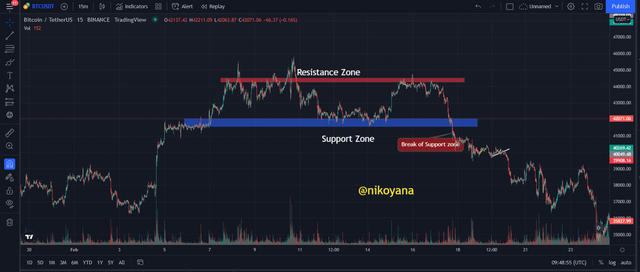
From the BTC/USDT chart, we can see that there was a little struggle between the support and the resistance before a breakout in the support zone showing that the sellers are having the upper hand after series of retest on the support
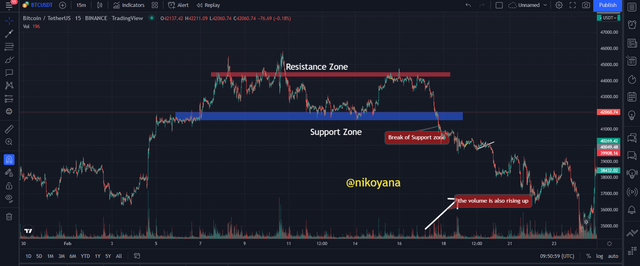
to break down a support, it is imperative to use technical or other filtering tools. If the low point of the new price is broken but not accompanied by an increase in volume, don't trust it. Use these screenshots as examples.
I am going to be explaining the false breakouts. Some traders engage in a false breakout, which will not lead to an extended movement in price. The trader will see the price essentially bounce off the levels and return to it's original value. This is something traders should take caution with because they could be trying to engage with an action that has no future.
Later, in reaction to this movement, the original resistance becomes new support that anchors prices lower before they recoup the previous locations and break through once again. We often see these scenarios near round-number values due to constraints on both physical traders who are buying or selling at those specific price points and automated traders who have been programmed with hard stop prices.
let's see an example below
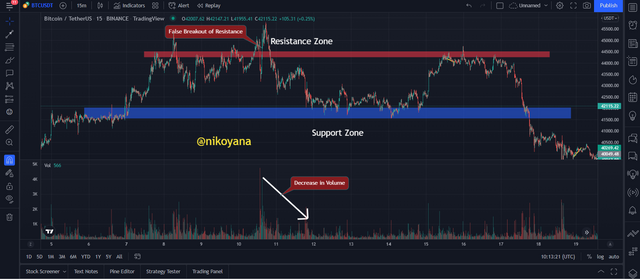
One way to avoid this is to filter the signal to limit the risk. This can be done by using technical indicators such as a volume as a signal for when to enter the trade.
Traders can narrow down false trading signals and buy or sell more accurately by focusing on the volume of buying and selling at a breakout of resistance. In the screenshot above, the traders could see that there was very little volume being bought and sold at the point of a resistance breakout.
One difficulty in trading is that there are many different price projections and each one becomes relevant at different points in time. Traders need to understand the many complexities and contexts that affect the supply and demand of a specific asset, because a breakout might be true only temporarily.
If the volume indicator doesn't increase at a breakout, it may be deceiving. As seen in the screenshot above, the volume indicator fails to increase at key points of failure and provides a sense of slight deception for investors.
In this question I am going to be placing a demo trade on the ETH/USDT chart as the price action breaks the resistance. If we look at the chart below, we can see the resistance and the support zone carefully marked and we can observe that there were series of retest on the support zone along side a fake breakout on the support zone.
we can see the price action rise towards the resistance and breaks the resistance. As soon as I see the break on the resistance, I crosscheck with my volume indicator and observed that there was a volume decrease and it is more profitable to go in for a sale as there would be a reversal.
I placed my stop loss against take profit at a 1:2 RRR and place my trade for a sell
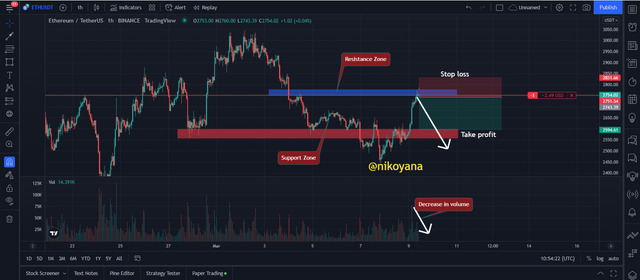
below are the results of my trade for a sell

In this question I am going to be placing a demo trade on the ETH/BTC chart as the price action breaks the support. If we look at the chart below, we can see the resistance and the support zone carefully marked and we can observe that there were series of retest on the support and resistance zone.
we can see the price action falls towards the support and breaks the support. As soon as I see the break on the support, I crosscheck with my volume indicator and observed that there was a volume increase and it is more profitable to go in for a buy as there would be a reversal.
I placed my stop loss against take profit at a 1:2 RRR and place my trade for a buy
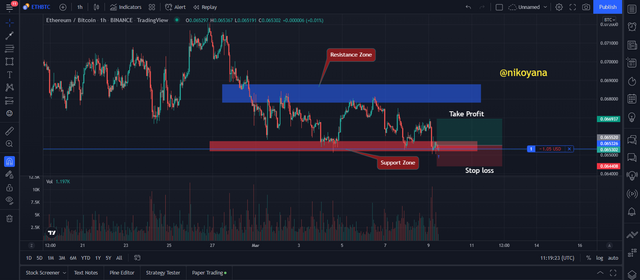
below are the results

Support and resistance usually occurs at key levels, so if you’re trying to generate revenue, it is important to be aware of these areas of the graph. There are two types of support and resistance, static and dynamic.
Support and resistance levels can give clues to the direction of the price, but a breakout may turn out to be false. To avoid losses when a breakout continues on decreasing in numbers, we should wait for confirmation before acting on it.
Traders should use technical indicators to focus their trades on the resistance and support zones. and et confirmation before placing the trade.
Best Regards
@pelon53
Image Reference tradingview