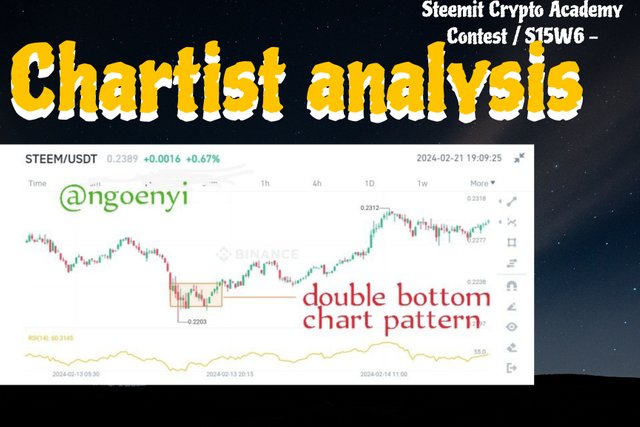
Steemit Crypto Academy Contest / S15W6 - Chartist analysis

The world of trading is very robust. There are various tools available to traders to make their analysis in order to have a good entry and make more profit.
There are basically two ways a trader can analyze the market. It could be by using fundamental analysis or technical analysis.
The technical analysis is where the chartist pattern falls into. What is the chartist pattern and how can it be of help to traders?
This will be considered in this week's crypto academy engagement. The topic is **
Chartist analysis**.
<center What is chartist analysis? And the importance of chart patterns.
Chartist analysis can be said to be a way of analyzing the market using a combination of candlesticks. So the usage of these combination of candlesticks to analyze the market is referred to as chartist pattern analysis.
There are various forms of candlesticks that we can see on the chart. Some of them are:
° Doji
° Hammer
etc.
These candlesticks are combined together to form patterns that are very useful in determining the direction, continuation, buy or sell of an asset pair. The chart patterns helps a trader to decipher interesting points on the chart regarding the price of an asset pair.
Using this chart patterns, traders can be able to identify supports and resistances, major levels that can be broken to determine buy or sell of an asset pair. It employs a lot of mathematical probabilities to predict the future price of an asset.
They can also show us areas of consolidation and resumption of trends, when a trend is weakening and also reversal patterns too.
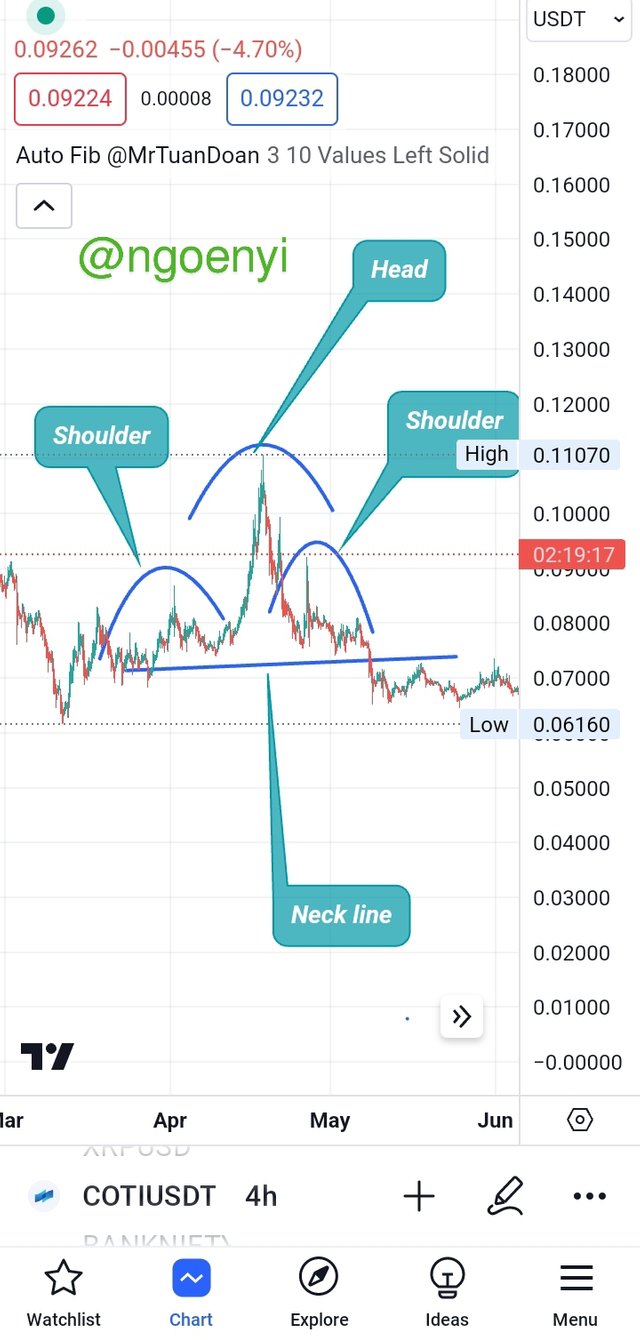
What is the shoulder head shoulder pattern? Show screenshots using the BTC/USDT pair. You can use another cryptocurrency pair if you wish.
Just like the name implies, it means a chart pattern that when drawn it has the shape of the two shoulders and head of a body.
That is to say, the head being in the center will be higher than the two shoulders the height of the 2 shoulders should be the same and there neckline should cut across horizontally. Sometimes, it could also be that the shoulders may not be of the same height and the neckline may be accending or descending which is determined by the shape of the shoulder.
When this chart pattern is shown on the asset chart, it means that there is going to be a breakout from the neckline. When ever price breaks out from this neckline, it reaches the height obtained from the neckline to the top of the head, when taken above the neckline.
The head and shoulder pattern are in two forms,
° The normal Head and Shoulder pattern - which if the neckline is broken, we are bound to see a serious downward trend.
Explain the formation of the inverse head shoulders pattern. Show screenshots of a cryptocurrency pair that displays this pattern.
This is the second form of the head and shoulder pattern.
Inverse Head and Shoulder pattern- this is the inverted form of head and shoulder pattern. It is usually seen towards the end of a bearish trend. The neckline is usually up above the bottom of the head and shoulder. When there is a breakout above the neckline, it will lead to a serious uptrend.
The screenshot below shows the inverse head and shoulder pattern using the BTC/USDT asset pair.
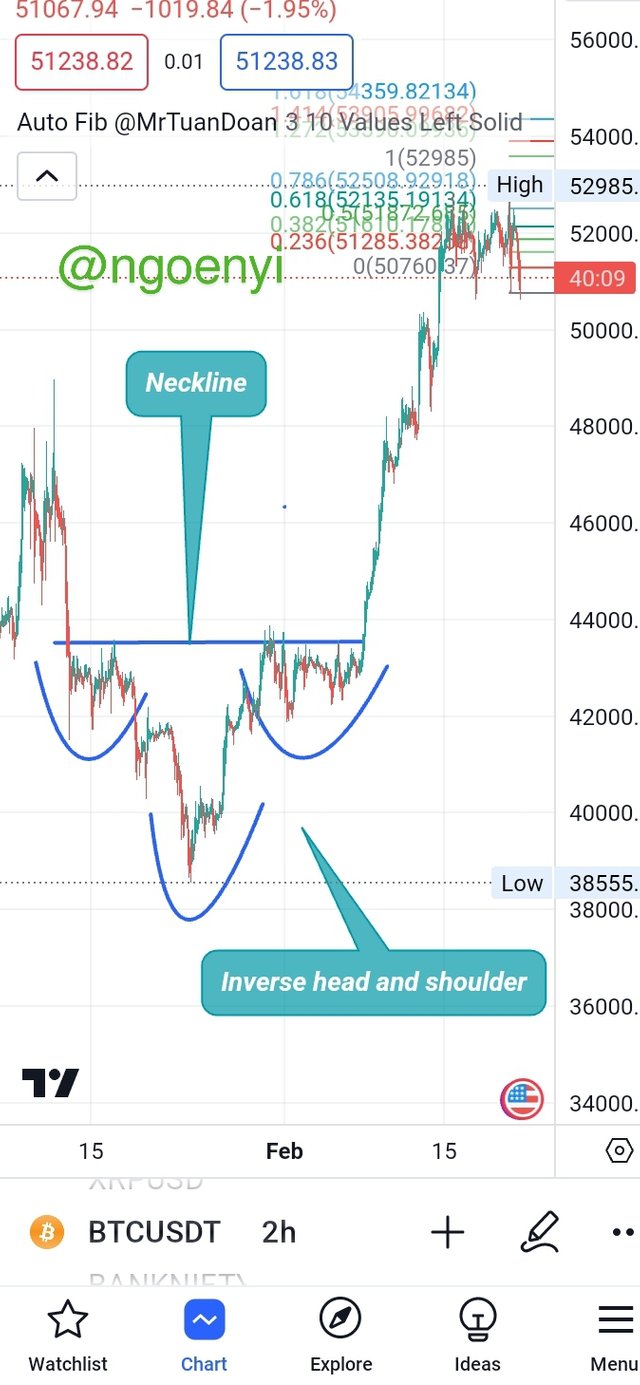
We can observe that it is just the opposite of the first head and shoulder. It signals a strong bullish trend once the breakout is confirmed. The distance the price will get to will be measured as shown in the chart below.
So for traders, the distance from the head to the neckline as shown by the vertical line, is the same distance it will get to when it breaks out from the neckline.
This same strategy for exiting the market is also applicable in the normal Head and Shoulders pattern.
For the technical analysis of the Steem, would you use chart patterns? Explain your answer.
Chart pattern are key in every technical analysis. No matter what indicator or tool is used, more precise confirmation comes from chart pattern confirmation. Why? Because it shows you what is happening in the market as at that time. The struggle between the buyers and the sellers.
So Steem is not left out at all. Chart patterns can still be used to technically analyze the Steem/Usdt pair.
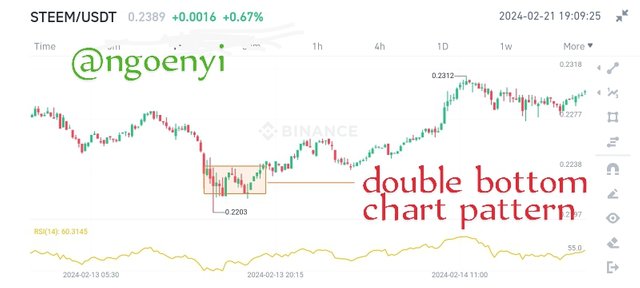
The chart above shows a chart pattern analysis in the shaded boxed area. We call this pattern double bottom chart pattern. This implies that the price was once more rejected at that bottom.
Most times when double bottoms chart pattern is seen, the price is seen to move upwards. The double bottom is an indication of either a short term reversal or long-term depending on the time frame.
So we can see that price obeyed that chart pattern.
This is still applicable when we have double tops. This occurs when price is rejected twice at a particular resistance. It indicates a short or long term bearish reversal depending on the time frame.
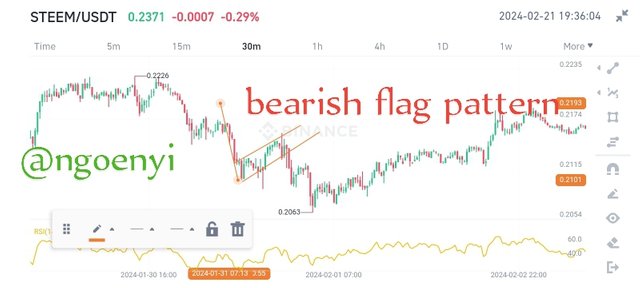
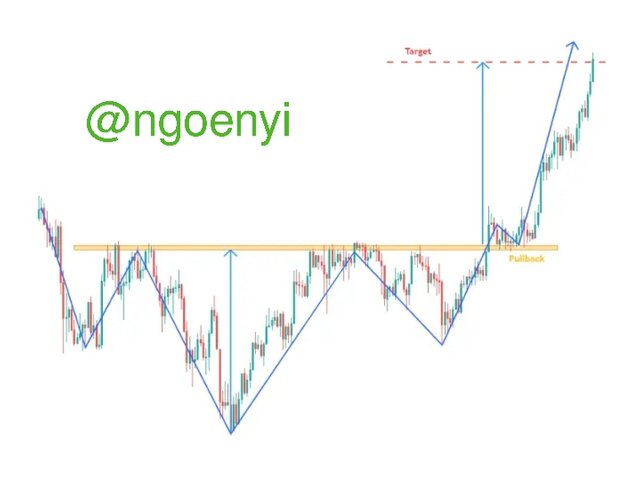
The chart above contains another chart pattern for Steem/Usdt pair. This time, the chart pattern is called the bearish flag pattern. When it does show on a chart, it Is an indication of the continuation of a bearish trend.
We can also see from the chart that the pair continued to sell downward in obedience to the bearish flag.
From the examples shown above, we can conclude that chart patterns are an integral part of technical analysis for Steem asset.
Conclusion
Chart patterns are very relevant in technically analyzing any asset, be it in the crypto market, stock market and even financial market. It tells you the market situation, the struggle between buyers and sellers on a real time basis. So every trader must know about them.
I will like @steemdoctor1 @sahmie @yancar @bossj23 and @starchris to take part. here
This is my introductory post here
TEAM 1
Congratulations! This post has been upvoted through steemcurator04. We support quality posts , good comments anywhere and any tags.Upvoted. Thank You for sending some of your rewards to @null. It will make Steem stronger.
Saludos cordiales hermosa amiga ngoengy, un placer para mi saludarte y leer tu participación en este reto tan bonito.
Siempre es rico y enriquecedor leer tus participaciones, posees un amplio conocimiento en este mundo de las criptomonedas, en esta ocasión sobre las figuras y patrones en los gráficos.
Te deseo una feliz, bendecida, bonita y productiva tarde.
Thank you, friend!


I'm @steem.history, who is steem witness.
Thank you for witnessvoting for me.
please click it!
(Go to https://steemit.com/~witnesses and type fbslo at the bottom of the page)
The weight is reduced because of the lack of Voting Power. If you vote for me as a witness, you can get my little vote.
In my experience as a trader, recognizing the normal Head and Shoulder pattern is crucial. If the neckline is breached, it often signals a significant downward trend, providing a key indicator for informed decision-making.
Based on what I know, spotting the bearish flag pattern in the Steem/USDT pair is crucial for traders. Its appearance often signifies a prolonged bearish trend, influencing my decisions on market positions.
From my observations as a trader, understanding the dual nature of the double bottom pattern is key. Whether signaling a short-term or long-term reversal depends on the timeframe, guiding my strategy adjustments to varying market conditions.
Good luck
Thanks for your article, Ngoeni. You have helped explain the importance of chartist analysis and the types of chart patterns. Using chart patterns, traders can determine the direction, continuation, buy or sell of an asset pair. The screenshots shown below give examples and explain the importance of chart patterns for technical analysis. Thank you!
https://twitter.com/Celina58042963/status/1760390170103210309?t=TNUS0Ltj_JSxhoM7UQIr-w&s=19
Greetings ma,
You are absolutely right. Chart patterns are like a window into the market. They're super important when it comes to analyzing different assets, whether it's cryptocurrencies, stocks, or other financial stuff. Basically, they give you a real-time view of what's happening in the market and show you the battle between buyers and sellers. It's like getting insider information on the market situation. So, every trader should definitely know about chart patterns. They're like a secret weapon for making smart trading decisions.
Thank you for sharing your insightful knowledge with us and say congratulations in the contest.
Congratulations!
Your post has been upvoted by @steemladies.
The community where the Steemian ladies can be free to express themselves, be creative, learn from each other, and give support to their fellow lady Steemians.
Manually curated by patjewell for Steem For Ladies