Introduction to the Principles of Crypto Analysis - Crypto Academy S4W7 - Homework Post for @imagen
Heya Steemians, I hope you are doing great? This is my submission to Professor @imagen for “Introduction to the Principles of Crypto Analysis” in Season 4 Week 7 of the Steemit Crypto Academy... The answers to his questions are as below;
.jpg)
What is Fundamental Analysis
Fundamental analysis is basically evaluating or assessing an asset based on its intrinsic value. This type of analysis is used to look at the whole project of an asset, all the way from the management, to its aims, as well as the operation of the project etc.
During fundamental analysis, we base it on data gained from news, statistics and economic reports to make our final verdict on the asset.
There are basically two forms of Fundamental Analysis. That is the Qyalitaive and The Quantitative form of fundamental analysis. Qualitative analysis is more inclined to the Blockchain, plans made by the company and news while Quantitative analysis deals with looking at figures of the company. They are more centred on the financial statements of the company.
What is Technical analysis
Technical Analysis is the form of analysis more centred on price movement. It can also be used to determine the volume of an asset by looking at the charts.
During technical analysis, indicators and technical tools are employed to improve the probability of spotting the right market direction and to aid traders to make good market decisions on when or not to enter a trade and when to leave a trade.
Most at times too the law of supply and demand is employed in Technical analysis. This enables traders to focus on past trends and parts where market direction change to predict future market outcomes.
Difference between Fundamental Analysis and Technical analysis
| Fundamental Analysis | Technical Analysis |
|---|---|
| 1. Fundamental analysis is used to check the actual intrinsic value of an to help predict future outcomes based on current statistics. | 1. Technical analysis is used to assess and predict the future price movement of an asset using charts. |
| 2. Fundamental analysis is used to determine whether an asset is performing well. | 2. Technical analysis is used by traders to buy or sell an asset in the market. |
| 3. Fundamental analysis based on the news, project statistics as well as economic report. | 3. Technical analysis uses past price movement from the chart with the help of indicators. |
| 4. Most investors and Big market makers use Fundamental analysis. | 4. Most Day traders, as well as Scalpers, also use technical analysis. |
The frequently used between Fundamental Analysis and Technical Analysis
When it comes to the one most used often I would say it's a tie game because For a trader to make a final decision it's best he looks at the asset from the fundamental point and also the technical point. Therefore as a professional trader, I would recommend that you employ both and not solely depend on one.
Cardano (ADA)
Cardano is one of the blockchain platforms that target the development of the decentralized application (DApp) and it employs Proof-of-Stake (PoS) consensus mechanism.
The development of Cardano began in 2015 and it was launched in 2017. The Chief Executive Officer of Cardano was one of the co-founders of the Ethereum blockchain known as Charles Hoskinson. Cardano has similar goals as Etherum does.
Also, the development of Cardano is in 5 phases namely: Foundation (Byron era), Decentralization (Shelley era), Smart Contracts (Goguen era), Scaling (Basho era), and Governance (Voltaire era).
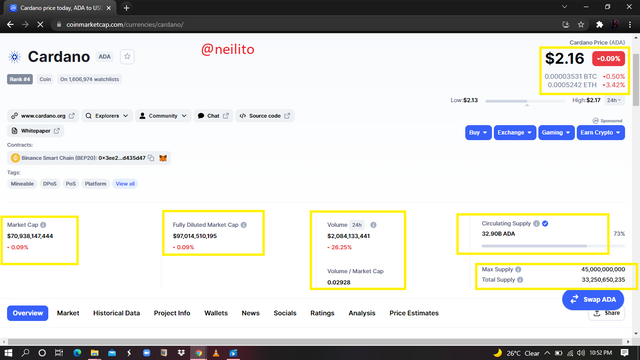
Financial Metrics Analysis of ADA
.png)
ADA is world-ranked Rank #4 . The price of ADA on CoinMarketCap as at the time of this research was $2.16, a 24 hours trading volume of $2,084,133,441, with a Market Capitalization of $70,938,147,444. ADA has a Circulating Supply of 32.90B ADA, a Maximum Supply of 45,000,000,000 ADA and a Total Supply of 33,250,650,235 ADA.
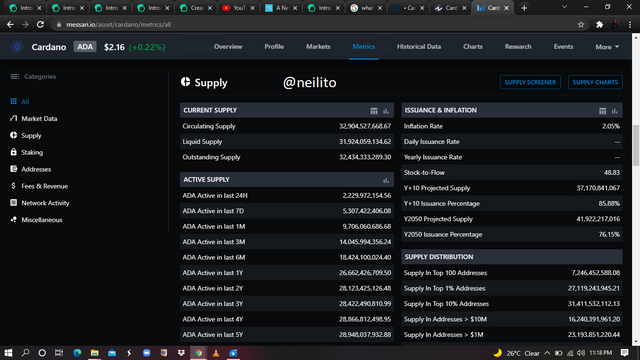
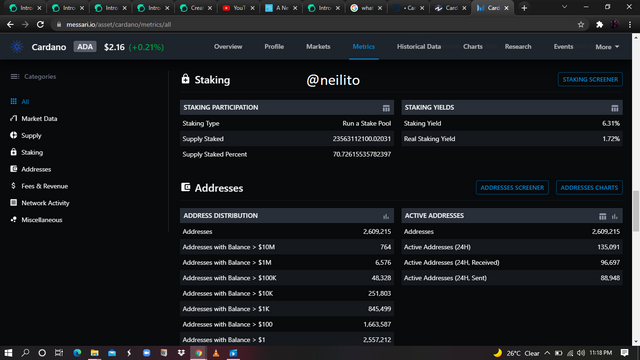
On-Chain Metrics Analysis
.png)
.png)
Make a purchase from your verified account of at least 10USD of the currency selected in the previous point. Describe the process. (Show Screenshots).
- First of all login into your account
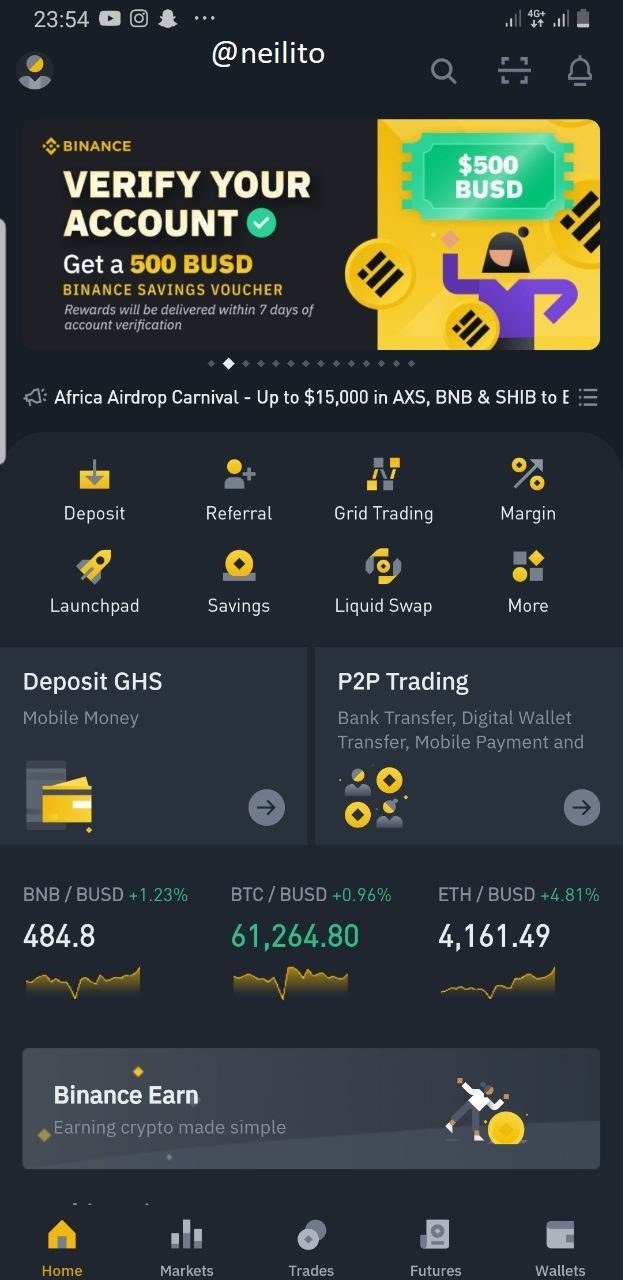
- The search for ada/usdt pair
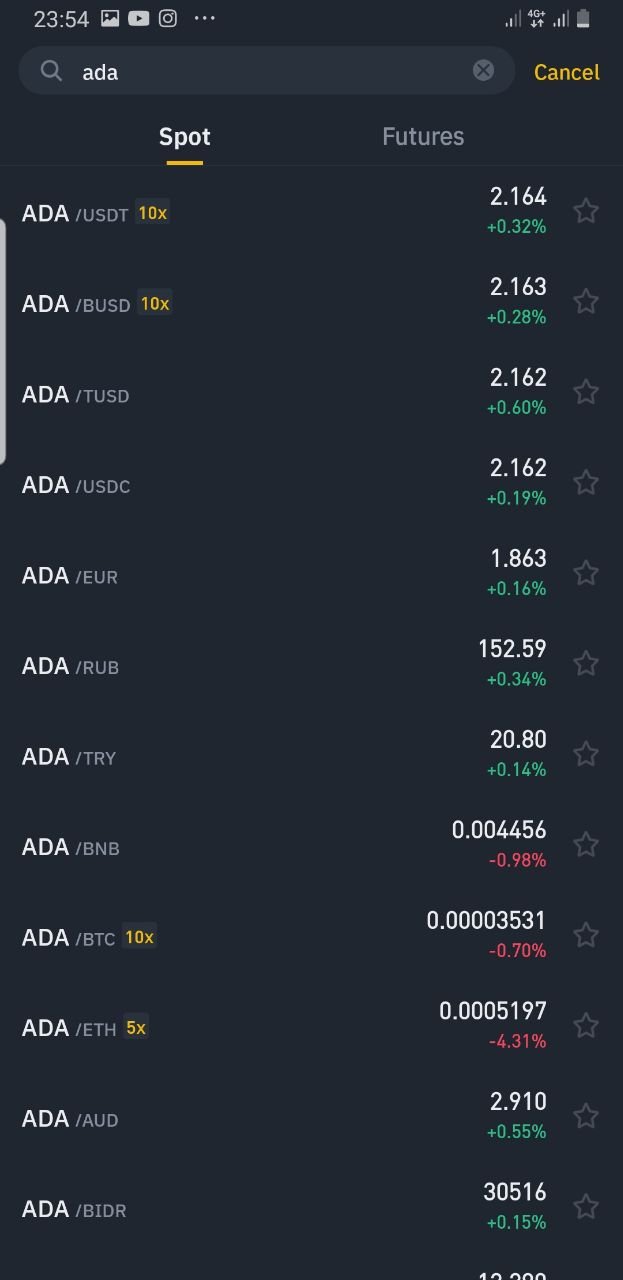
- After that you input the amount you want to buy and use market execution to place the order instantly
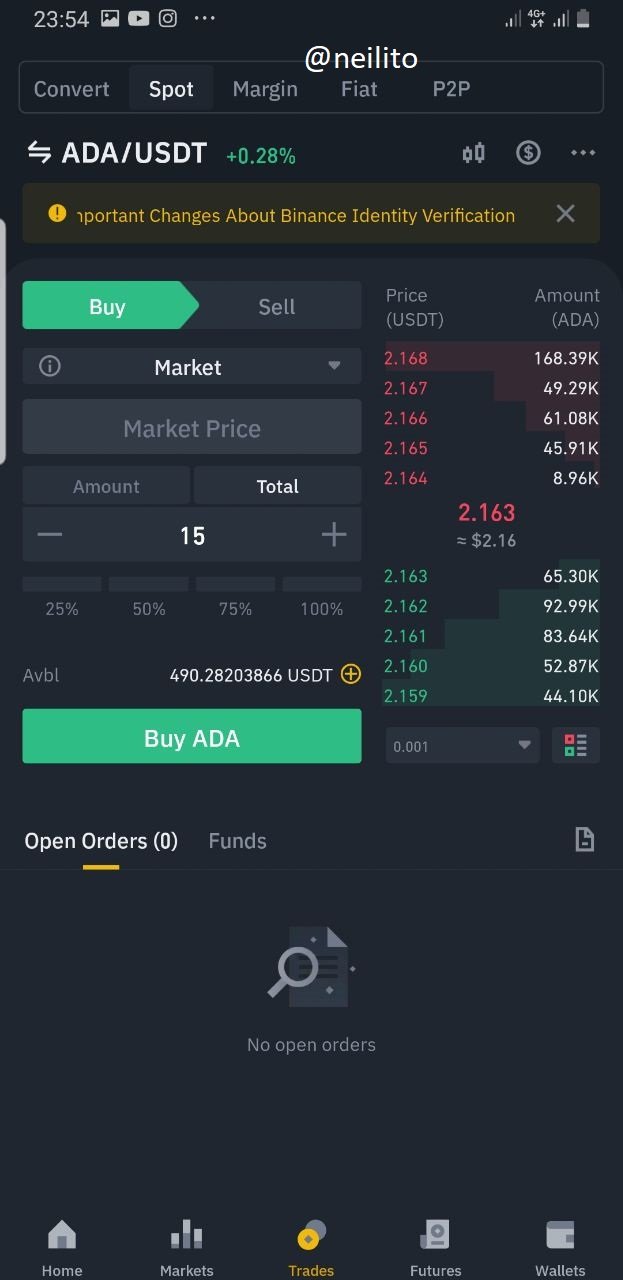
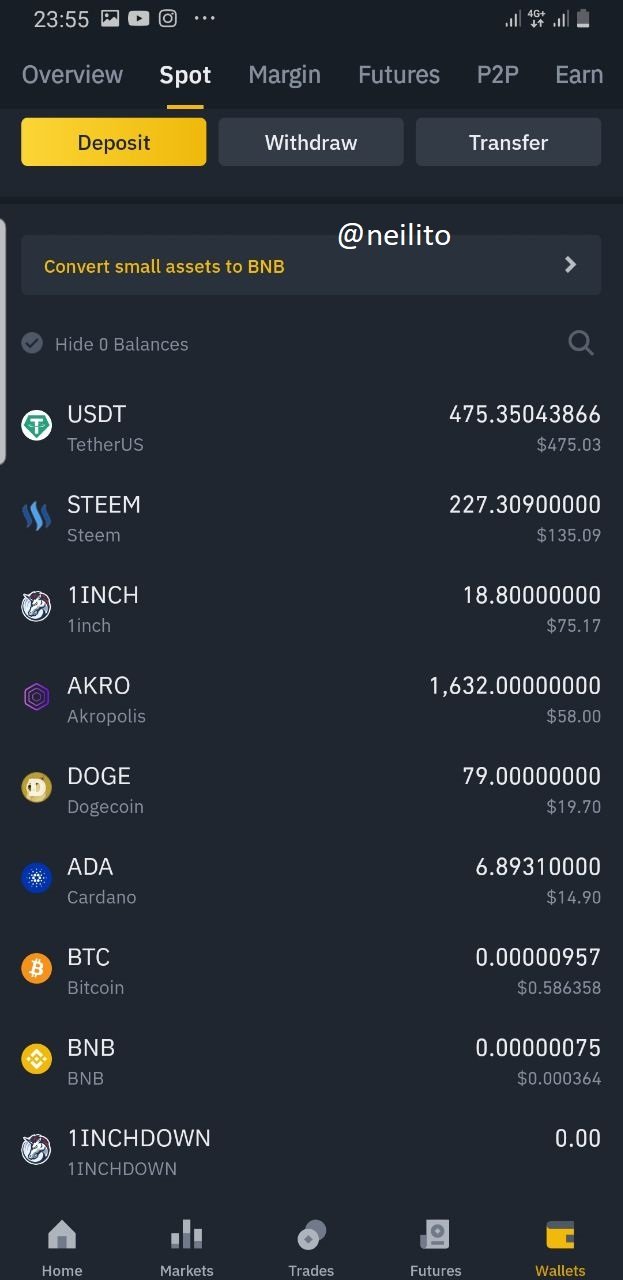
You can then see the amount in your wallet
Bollinger Bands
The Bollinger Bands is an indicator used for technical analysis. The programmer of the indicator is John Bollinger.
When you set the Bollinger Bands on the chart you see 3 bands that are upper, middle and lower band. This indicator can help determine trends. The upper band suggest an overbought market if the price reaches it and also the lower and indicates that the market has been oversold if the price reaches there too. Usually, when price hovers in the middle band it indicates a ranging market,
Also when the price is in between the upper and middle band it indicates an uptrend and if the price is in between the lower and middle band it is identified as a downtrend.
Combining Bollinger Bands and moving averages to make trades
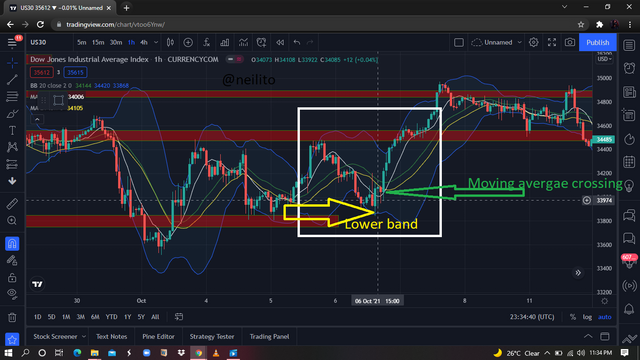
So a simple strategy by combining Bollinger bands and moving averages is as below.
First of all, we wait for the price to touch either the upper band or lower band suggesting overbought or an oversold market.
After seeing that you wait for the 2 set moving averages to crossover to indicate a change in market direction. In this test, I used the 21 and 9-day moving average.
You can see that price had hit the lower band and then there was a crossing of the two set moving averages indicating a change in market direction which suggested a buy signal.
.png)
Well explain of what a fundamental analysis.
Thank you. :)
Gracias por participar en la Cuarta Temporada de la Steemit Crypto Academy.
Continua esforzandote, espero seguir corrigiendo tus asignaciones.
Thank you Prof.. I couldn't start my assignment early and that's why I couldn't make enough research to complete everything...Will do my best to complete earlier next time..
But please I saw only Five questions.