"[Trading Using Rectangle Pattern] - Crypto Academy / S5W4 - Homework Post for @sachin08".
Hello everyone!
This is nabeeel from Pakistan its my 2nd class in This academy under the supervision in Professor @sachin08" and I am glad that we have a lot to learn from you. In this lesson i will share my Knowledge about Trading Strategy using Rectangle Pattern
Edit in CoralDraw
Introduction
As we know after the COVID-19 attack, many people choose to trade because of the high unemployment rate in the world, peoples started trending towards which made people sitting at home multiplying their profit a hundredfold. On the other hand, many newcomers traders have suffered, although there is nothing wrong with the trading site., their useless discovery is responsible for this loss,
If you want to earn more you should thing wisely buy assist on good time and also sale assist on good time to avoiding loses, for this many Trending website support his pro and newbie traders with unique and helpful tools, Indicators and patterns. there are different patterns for best trading ascending triangle. The ascending triangle is a bullish 'continuation' chart pattern, Rectangle Flag, Wedge, Double bottom, Double top etc. in this class our topic is about trading Strategy using Rectangle Pattern. These all patterns are necessary in trading

1. Explain Rectangle Pattern in your own word
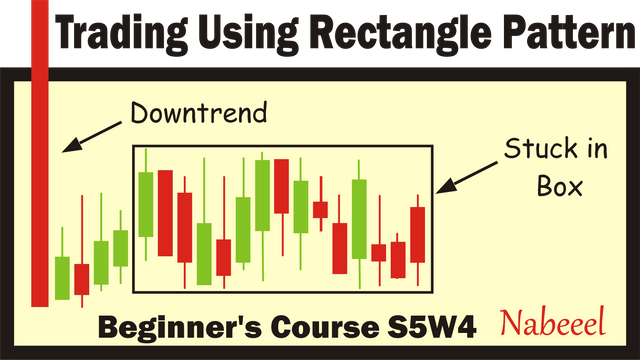
Four right angles make a rectangle, a shape with four sides opposite each other. but in other side, cryptocurrency chart, a rectangle here comprises two opposite horizontal line cover top serving as resistance point and bottom trending lines serving as support point called rectangle.
Rectangle pattern can be formed in the chart through two ways, at the top of the chart which is called rectangle top and forming below the chart which is rectangle bottom. These are help full trick can be able to predict which trend will take place,
Buyers could be take good place in market that can buy assist in low price, or sellers could be take over the market to get good profit.after the ranging movement in the market price when there is breakout in the pattern, that a particular trend is about to take place uptrend or downtrend,
2. How to identify Rectangles. Explain with Screenshots.
Trading with the help of rectangular pattern is very simple if you can be able to identify the rectangle, spot breakout range.
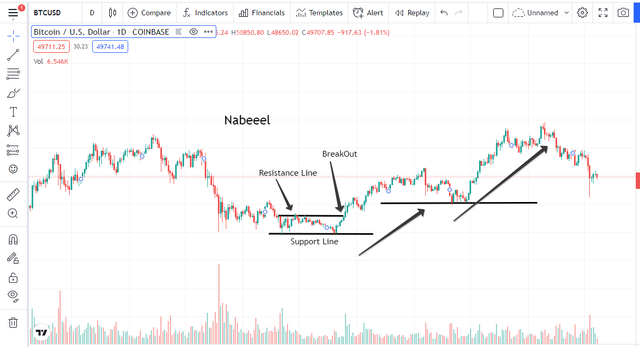
Raging of price make rectangular pattern when ever price of an asset moves between the horizontal support and resistance Levels on the chart, A breakout show the price is moving away out of the rectangle.
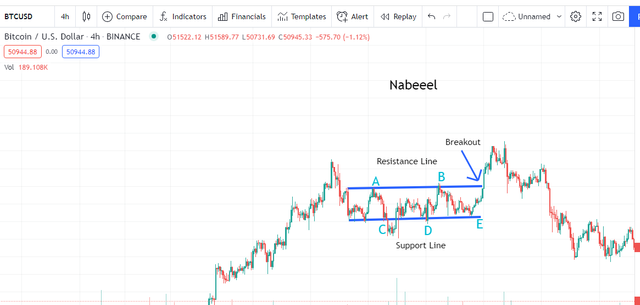
BTCUSD/TradingView/Nabeeel
Lets me explain that i put BTCUSD time 4h and Binnance Exchange chart above, Two thick line with blue colors on the top called resistance line and second one at bottom called the support line that are making rectangle,
There is A,B label at upper line that show assist touch the high of this rectangle, and the same C, D, and E each time the price also touches the trend-lines. B to E in rectangle Price go down when the price reach on E mark, then price start moving uptrend, and continuously up and Breakout the rectangle pattern, and the price started moving uptrend. BTCUSD chart show its a Bearish trend.
3. Can we use indicators with this pattern to get accurate results? Explain with Screenshots.
The best trading website tradingView give us many helpful indicators to getting more information about an assist. so we can read better about movement of the price of assist. some time indicators give errors to we could go in lose, many time indicator and the chart price of the asset would help the trader/investor make successful trading.
Lets apply the indicator for giving good example of how to use indicator in trading,
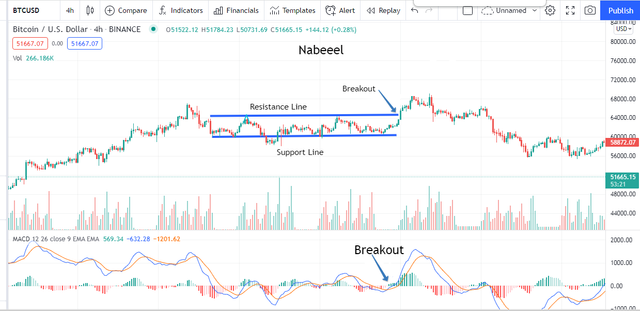
TradingView/MACD-Indicator/Nabeeel
I have perfect grip on MACD indicator, in rectangular pattern i will use MACD indicator.
The indicator show downtrend in red color and uptrend in green color in different size of bars, that show that market is current in raging. with light and dark red candle rectangular structure formed, from the indicator, when price break the rectangle its make dark green.
same when market go in downtrend the indicator make same light and dark short bars.
4. Explain Rectangle Tops and Rectangle Bottoms in your own words Screenshots of both patterns
Let me explain how to identify a rectangular top or bottom, the idea is simply to take a look at the preceding trend.
Rectangular Tops and Rectangular Bottom. indicate two different type of bullish and bearish trend. The Rectangular top simply happens are a result of the uptrend in the price of the traded asset while the Rectangular, when the entry of the price asset is at the top of the trend. you can see rectangular top pattern in BTCUSD chart,
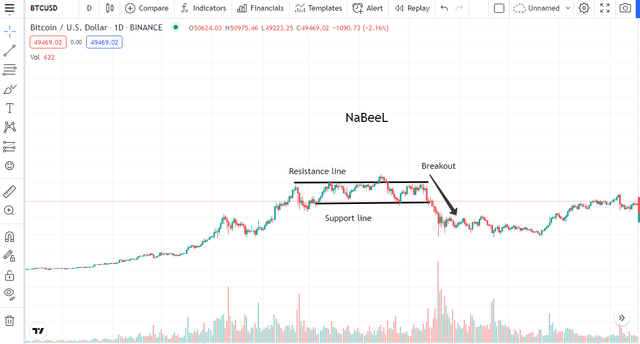
The rectangle bottom in a simple that in above screenshot, can be found at the bottom of the chart, market is in raging mood, price breakout on Resistance line and there is breakout, market turn in Bullish so its happens when buyer take interest in specific assist.
in BTCUSD chart i have never see this type for fall after this rectangle breakout price of assist never come back. in other lower support level is still high more then previous rectangle resistance level.
5. Show full trade setup using this pattern for both trends. EntryPoint, TakeProfit, StopLoss, Breakout
BTCUSD with 4h time i take screenshot that is blow,
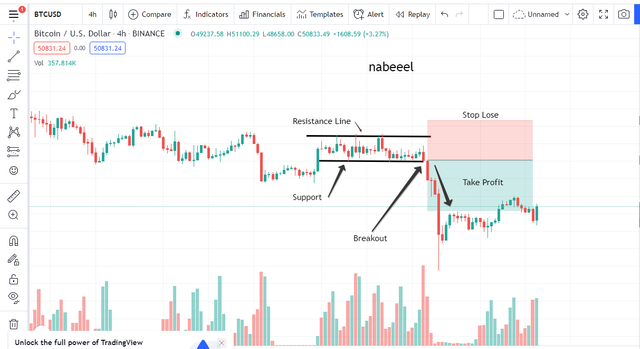
We make a rectangle when price is in raging phase and then the breakpoint give us help to buy or sale. in this screenshot you will see that the rectangle pattern formed is touching both horizontal lines, when assist break support line. The breakout point occur that show there is a entry point that indicate we should sale our assist to avoid more lose,
In this BTCUSD Chart i set that you can see below in image.
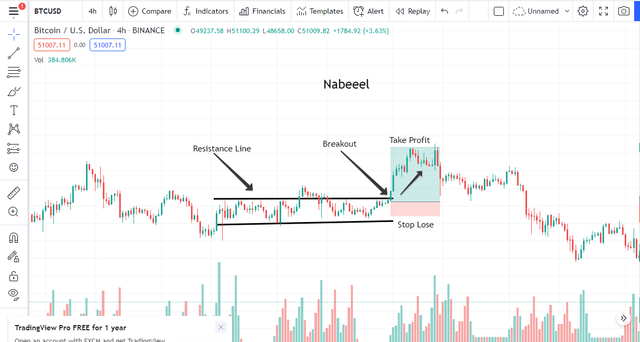
When we make rectangle to read the chart and assist break his Resistance line that point give us profit. This is the simple to understand , the take profit will be set above the resistance level and the stop loss will be just below the support line. At the time of Breakout, We can take our entry and then We can mark Take Profit.

Conclusion
We have learn about Trading Strategy using Rectangle Pattern Because these patterns are very good to avoid lose , and these patterns also help to looking what is the next trend of this specific assist in market, i also Learn how rectangle make its TOP and BOTTOM. Thanks you Professor @sachin08 for this beautiful lectures for I have been able to grabbed so much knowledge from it and also learn many thing about trading setup .
Borders, Screenshots are my Property. I also 195+Steem Powerup in previous Month to being the part of season-5 and getting #club5050 Marks