[Trading strategy with RSI and ICHIMOKU]- Steemit Crypto Academy- Homework post for Professor @abdu.navi03 by (by @mustafaasif
Hello everyone, how are you doing? We're now in the second week of the Crypto Academy, and this week I'll be attempting Professor @abdu.navi03's Trading Strategy using RSI + ICHIMOKU. Let's get started:
Q1. Put your understanding into words about the RSI+ichimoku strategy
There is no such thing as the best indication. First, let's get things straight. A single indication on a chart can never provide 100 percent accurate signals. It is also dependent on the strategy and the traders' comfort level. The Relative Strength Index (RSI) evaluates the movement of an asset's price over a certain period. The RSI provides two indications: overbought and oversold circumstances. When the RSI number exceeds 70, the market is said to be overbought. An overbought condition indicates that the price is likely to fall in the near future. When the indicator falls below 30, it is deemed oversold, implying that the price will likely rise shortly. However, there are a number of disadvantages of employing RSI, which include:
- There are no signs of market volume.
- When there is a continuous trend, this method does not perform effectively.
The Ichimoku helps us assess marketing and service, supporting, and resistance levels. Tenkan-Sen, Kijun-Sen, Senkou Span A, Senkou Span B, and Chikoi Span comprise it. However, there are certain flaws with the Ichimoku, such as late signals.
When we talk about combining the RSI with the Ichimoku, things start to become serious and genuine. Mixing the RSI and the Ichimoku provides us several benefits, including:
- detecting the pattern earlier on.
As a trader, spotting a trend early always works in your advantage. This allows you to open positions and make winning trades.
- Getting Rid of False Signals
Oscillating indicators, such as the RSI, can occasionally produce erroneous indications. We can eliminate misleading signals by combining these two indicators.
- Divergence of Bearish and Bullish Trends
Using the Ichimoku in conjunction with the RSI can provide us with early and noticeable bullish and bearish trend indications.

Q2. Explain the flaws of RSI and Ichimoku cloud when worked individually
RSI flaws when used alone
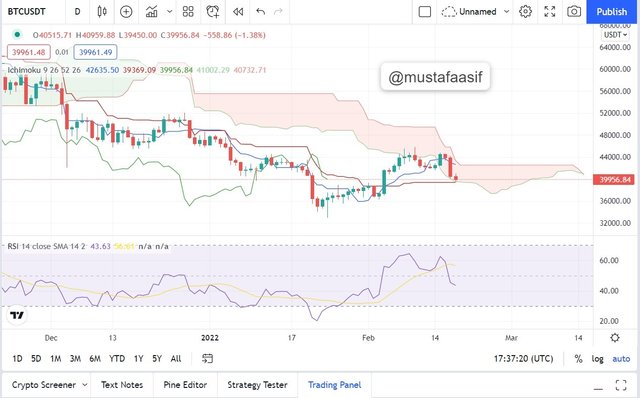
The Relative Strength Index is prone to producing erroneous signals. Sometimes we observe the RSI lone climbing up the oversold circumstances, which should indicate that the asset's price is ready to move bullish, but in fact the price drops even deeper, resulting in massive losses for the traders. Alternatively, the RSI may produce a misleading negative warning if it falls below the overbought level. The trader believes that the price is set to fall, but in actuality, the price rises.
Furthermore, RSI is not suitable for scalp trading since it oscillates for a long period in overbought or oversold levels, making it difficult to identify excellent trading chances.
As you can see in the example above, the RSI suggested a downward movement, but the price continued to rise.
Ichimoku flaws when used alone
Ichimoku is one of the greatest indicators available, although it, like other indications, has drawbacks. The most fundamental and serious problem connected with the Ichimoku is that it emits delayed signals. For example, there is the beginning of a bullish trend. To benefit from this, a trader would need an indicator that sends out excellent indications before the trend begins. Only then would it be able to capitalize on the current trend. However, with Ichimoku, the indications might be so late that it becomes impossible for the trader to have winning transactions. The trend is already in its last stages by the time Ichimoku begins to flag it.
Q3.-Explain trend identification by using this strategy (screenshots are required).
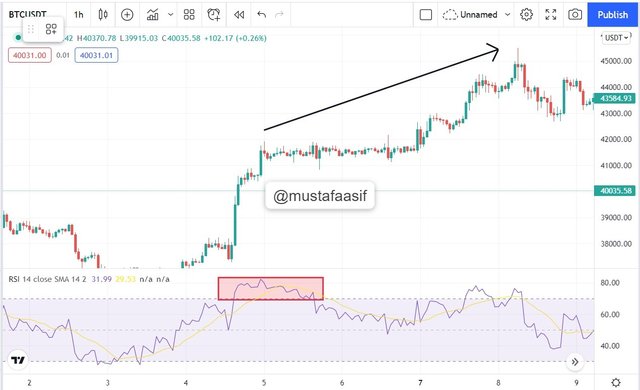
When used together, the RSI and the Ichimoku may provide ideal trend detection signals, which were previously missing when employed separately. The most essential thing is to have both signs in mind at the same time.
In the case of a bullish trend, the RSI will create a dual top in the excessive area. What does this imply? We'll see the RSI indicator signaling an overbought position, correcting somewhat, and then over the 80-line threshold again. Now, to be absolutely certain of trend identification, we'll employ the Ichimoku, which will validate the trend motion by being lower than the price action.
In the preceding presentation, we can clearly see how both indicators assist us in signaling a trend identification, which can be highly successful in trading.
Q4. -Explain the usage of MA with this strategy and what lengths can be good regarding this strategy (screenshots required)
We can also use MA Indicator with this technique, and integrating MA Indicator would assist us a lot in signal purification.
MA Indicator is my favorite. So, I'll utilize the 100-day MA in the chart along with the RSI+Ichimoku Strategy to find indications.
Let me first explain the MA Indicator. When the MA Indicator travels above the price, it signals a downtrend, and when the EMA moves below the price, it shows an upswing.
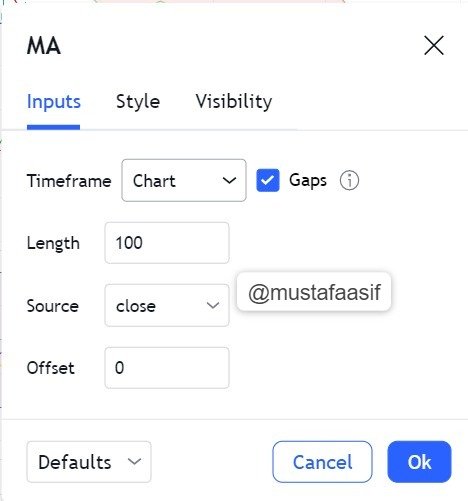
For this method, I will use a 100-day moving average. Because a short length MA is already provided in the Ichimoku Cloud, 100 length will be beneficial for this method. As a result, longer period duration MA will be beneficial in this method.
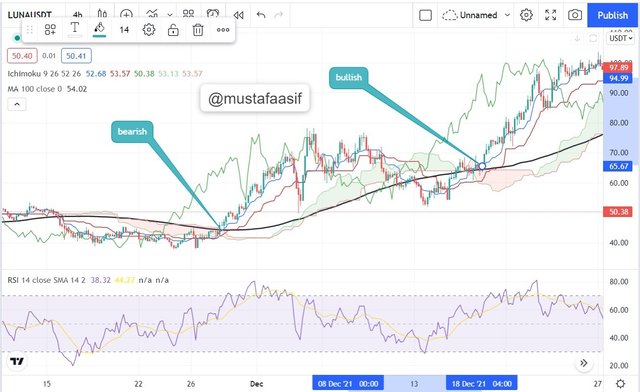
As you can see in the above figure, I used the 100-day MA in conjunction with the RSI+Ichimoku Strategy. And when the MA falls below the price, the price rises; when the MA rises above the price, the price falls; and we can validate this with the RSI+Ichimoku Strategy. As a result, using the MA Indicator with this technique will be quite beneficial to traders.
Q5. Explain support and movement with this strategy (screenshots required)
Well, support and resistance are critical trading variables. Traders should constantly look at the resistance and support levels, which may be identified using the RSI+Ichimoku Strategy.
If the market is trending, we may use the Ichimoku Cloud to find Support and Resistance levels. If the market is sideways, we may use the RSI to determine support and resistance levels.
In Trend
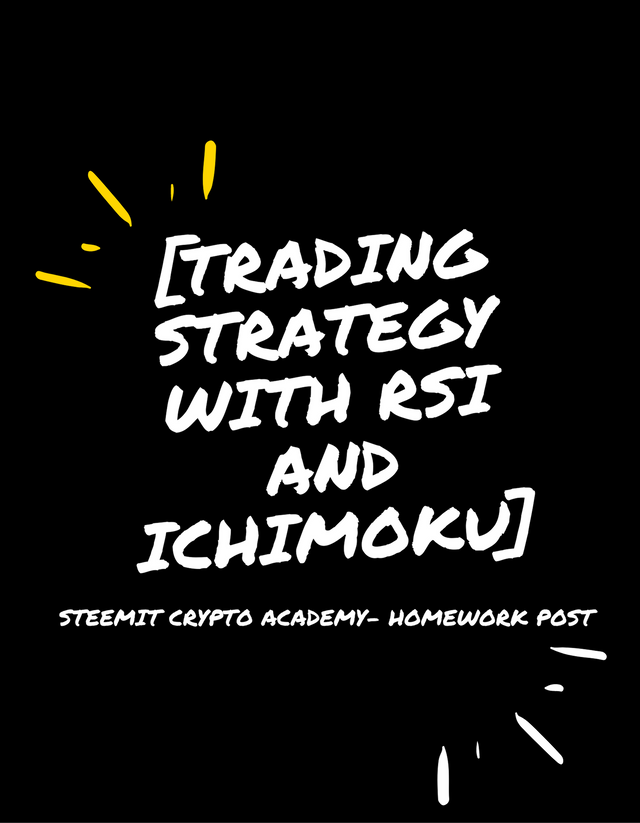
If the market is trending, we can simply find Resistance and Support levels using the Ichimoku Cloud. If the Ichimoku Clouds are green, it is termed a Support Level. If these clouds are crimson, it indicates a high Resistance Level. As you can see in the image below, I have indicated the relevant items in the image itself.
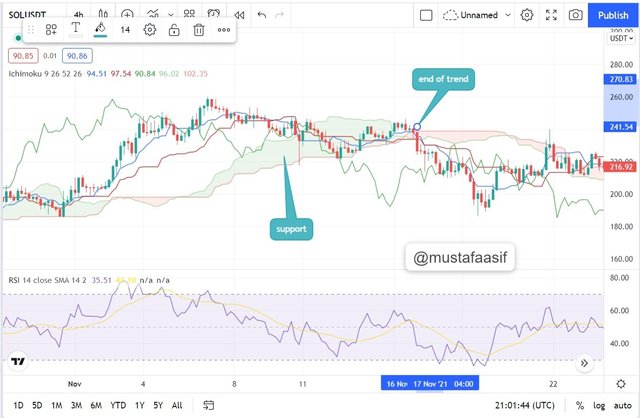
When the market is in an uptrend, the green cloud serves as a support level, as shown in the above graphic.
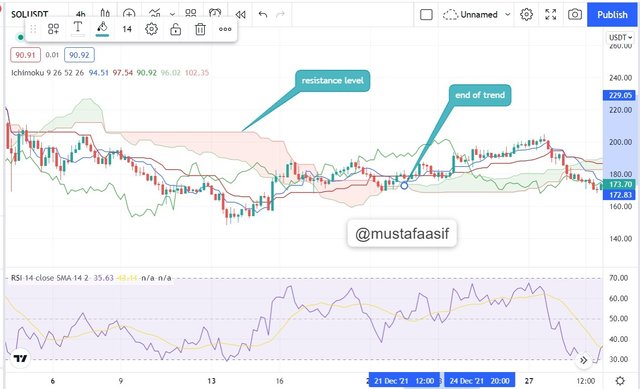
When the market is in an uptrend, the red cloud serves as a resistance level, as shown in the above graphic.
Another critical aspect is that we can determine if the trend is strong or weak. We can tell by looking at the price's distance from the clouds. The greater the price spread, the stronger the trend.
In Sideways Market
If the market is sideways, we may use the RSI Indicator to find support and resistance levels, while Ichimoku does not provide much better results in this case.
As seen in the graphic below, the Overbought area reached by the RSI Indicator works as a Resistance level here, while the Oversold region achieved by the RSI Indicator functions as a Support level.
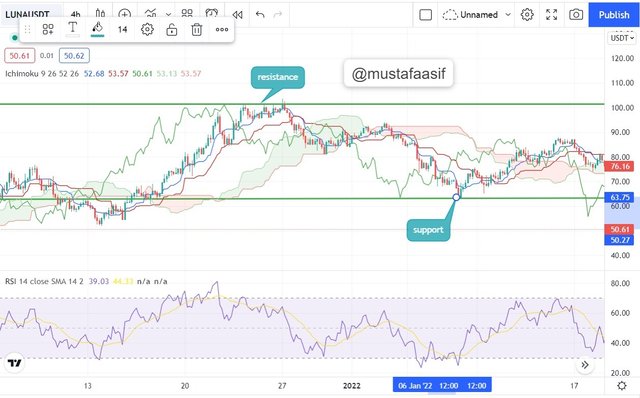
The RSI has detected an overbought and an oversold zone in the preceding figure, and I have labelled the overbought region as a resistance line and the oversold region as a support line.
Q6.In your opinion, can this strategy be a good strategy for intraday traders?
The RSI + ICHIMOKU technique, in my opinion, might perform quite well in favor of intraday traders. What's the deal? The RSI indicates overbought and oversold levels, would that be enough? We obtain better results when we combine the RSI with the Ichimoku cloud. We obtain rapid indicators of trend identification, we can get wonderful cooperation and resistance levels, and most significantly, we can get good exit and entry opportunities in the market by utilizing both of these Indicators together.
That being said, I will constantly point out that no indication provides 100 percent accurate results. It all depends on the trader's comfort level and grasp on any indicator. Using both of these indicators together may significantly enhance your trading selections, since some of these signals will assist you in both scalp and swinging trade.
Q7. Open two demo trades, one of buying and another one of selling, by using this strategy
- SELL TRADE (TRX/USDT)
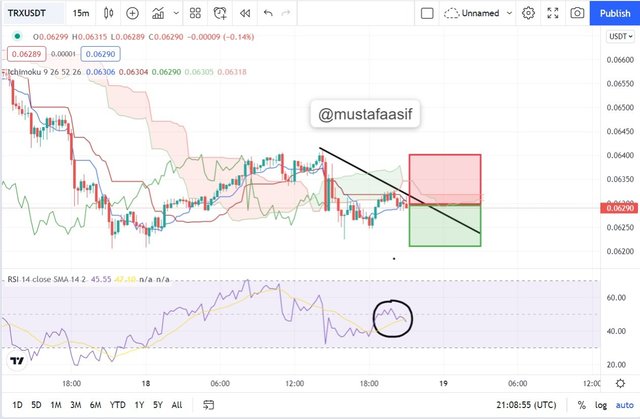
In this TRX/USDT demonstration, I employed the RSI + ICHIMOKU technique, that performed well in my favor. The Ichimoku cloud, which was above the price action, functioned as resistance, and the RSI was fluctuating towards the midpoint following a positive advance. I opened a sell trade with no stop loss and no take profit.
- BUY TRADE (GALA/USDT)
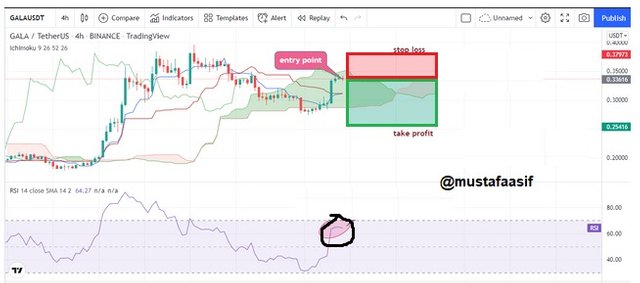
In this example of GALA/USDT, I noted the Ichimoku cloud acting as a barrier, as well as the RSI, which was heading in overbought territory. With the prospect of a double top, I entered a buy trade with a 2:1 stop loss and take profit (R: R) The transaction was completed.
CONCLUSION
This is a terrific technique for utilizing these two exceptional indications. When applied in both intraday and long-term trades, the RSI + ICHIMOKU method may be quite successful. Both of these indicators compensate for the deficiencies of the single indicator. In a sideways market, the RSI indicates overbought and oversold circumstances, as well as strong signals of support and resistance levels. In trending markets, the Ichimoku helps us determine momentum, buying and selling pressure, and early trend identification.
I like this season's attempt to focus more on trading because we students are learning a lot from these lectures. I had a lot of fun creating this task, and I hope you all liked reading it as well. Thank you, prof. @abdu.navi03, for your informative lesson. I eagerly await your future assignments.