Trading Strategy with Median Indicator - Steemit Crypto Academy |S6W4| - Homework Post for Professor @abdu.navi03
Hey to everyone. How are you all getting along?, I'd like to welcoming you all back to the fourth week of the crypto academy season. In the week, we'll be focusing our research on cryptocurrency trading, and I'll be explaining how to trade utilizing a common trading approach known as the Median Indicator.

Question 1 - Explain your understanding of the median indicator
The median indicator is a leading indicator predictor that portrays messages in a movable connection. The normality is recognized to showcase messages inside a movable line in a manner similar to the Exponential moving average indicator, the exception being that the indicator portrays buy and sell signals in green and purple, including both.
The indicator can be used to analyze the market motion, especially whenever we see the criterion has merged the market towards the top, which indicates a bear market. In that scenario, we will be seeing a thick purple line crossing the market to the top and travelling above market price, while we get to signal a buy entry when we see the green median line portraying below market price.
The median indication provides a signal of the market's middle price, i.e., the average price of an asset, which is generally the average total of market participants; the indication determines its medium that use the median stock's Normal Reference Range (ATR). When traders are able to use the Median indicator well, we may employ a safe trade since the indicator delivers its better reception in a short time period.
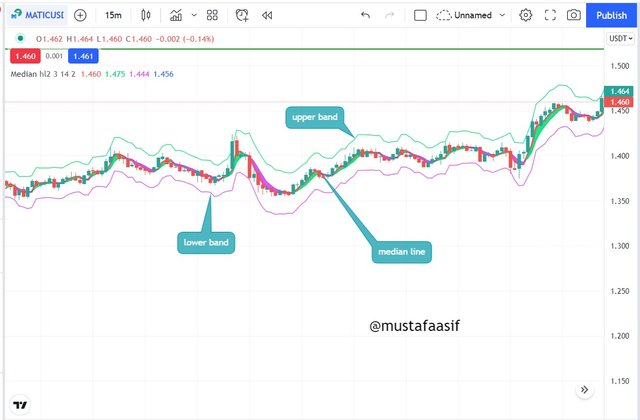
The figure above depicts how the Median indicator appears on a chart; we can see the top band line, which is thin, the bottom band line, and the thick median line, which reveals who is denominating the marketplace among market participants.
Question 2 - Parameters and Calculations of Median indicator. (Screenshot required)
Parameters of the Median Indicator
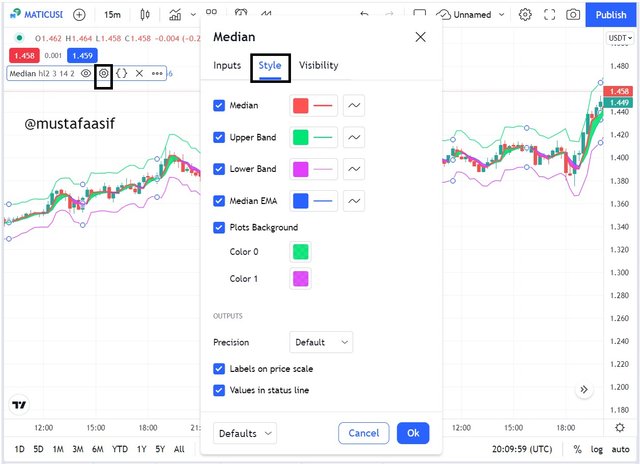
Before we modify the values, let's have a look at how to add the median indication.
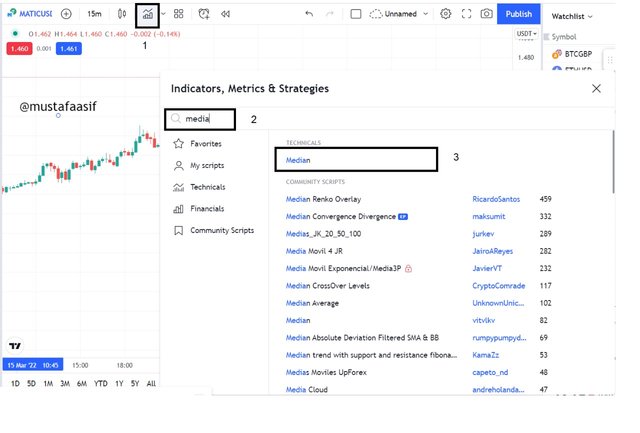
You go to https://www.tradingview.com/chart/, select a live chart of your choice, click Indicator & strategy [1], search the median [2], and then double-tap on the recommendation to have the indicator added on a chart.
To modify the variables of the marker, click on settings, then on the input side of the settings, we get to adjust the median length, the ATR length, the ATR multiplier, and others. We must better remembered not to tinker with the marker duration if we are not sure of its method of calculating, as any manipulated in any way on might lead to the marker giving incorrect signals.
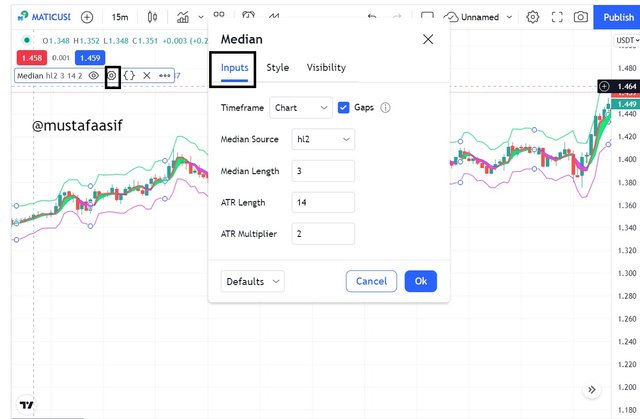
The collected data where the median value is computed is referred to as the median source.
Median Length - is the length of the median, which reflects the quantity of data upon which value is derived.
ATR Length - The ATR length is the time period utilized to calculate the median ATR.
ATR Multiplier - the amount multiplied by the ATR just before zones.
The next modification we could do, in addition to the styles options, is to vary the opacity of the line, change the colour, and increase the line thickness, among other things.
Calculations of Median indicator
The computation of the median indicator appears to be quite difficult, which is why traders do not need to be concerned about it because the indicator performs the calculations itself.
The median price is calculated by adding the average cost of every candlestick for a certain period, dividing it by the period average price, and then dividing the amount by the time frame amount.
- Average Price = (Highest Price + Lower Price) / 2
Median = (Average Price + ATR ) / ATR
The ATR at default is 12, therefore
Median = (Average Price + 12) / 12
While the median result is presented in colour, with green representing purchase and purple representing sell.
Question 3 - Uptrend from Median indicator (screenshot required)
We recognize a rising trend whenever the median result is green. At that point, we can see the thick line travelling below the market rate, which is the finest bid to defend a buy entrance. The take financial gain is set just above entrance as long as the economy remains green, and the stop loss is set at 1:2 or the quantity this same merchant is ready to chance.
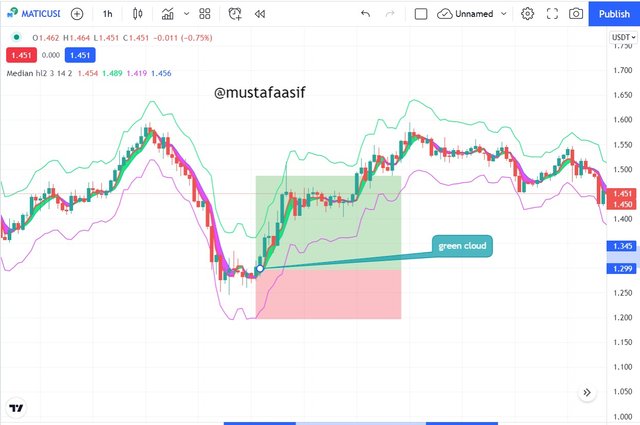
The figure above indicates an excellent entry to purchase when the green median line intersects the purple line, indicating a recovery from the negative market, followed by the market being in an uptrend.
Question 4 - Downtrend from Median Indicator (screenshot required)
A declining trend could be recognized whenever the median effective research a purple colour, at which time we could see the thick line travelling well above market rate, at which point the turn profit is set below the entry as the market continues to depict purple, and the stop loss is set at 1:2,1:1 or the quantity this same trader is prepared to risk.
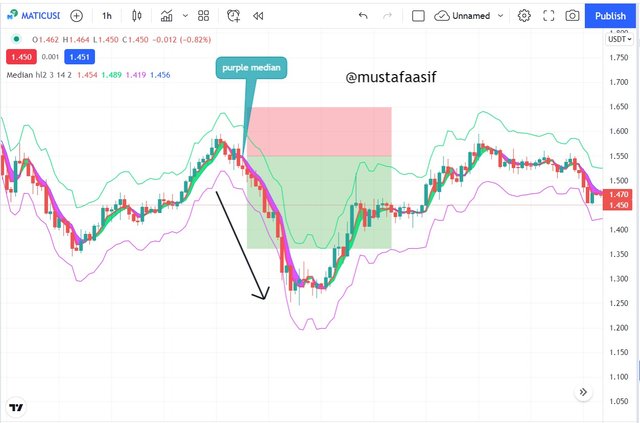
The figure above indicates a fantastic entry to purchase when the purple median line intersects the green line, indicating a recovery from the bullish market, followed by the market moving into a downtrend.
Question 5 - Identifying fake Signals with Median indicator(screenshot required)
Trend finding also supports have just a background about over filtration signals, that also helps make each other inaccurate almost all of the time, which is why they should not be used as a standalone marker whilst also trading. Instead, the average measurement can be used in conjunction with other metrics such as RSI, which signals overbought 70 lines and oversold 30 lines.
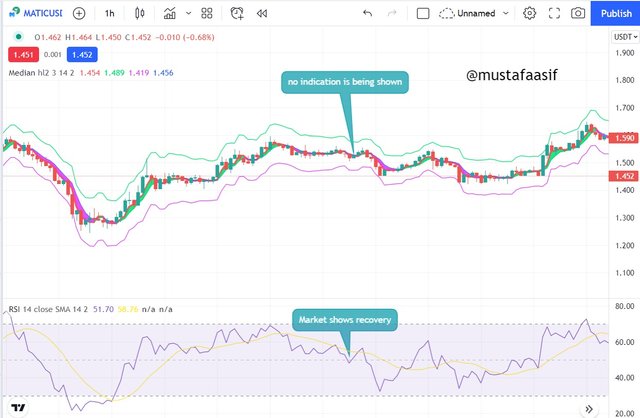
The image above confirms the lagness in the median indicator, as we can see from the image that the market has shown a slight healing, however the median indicator continues to depict a purple line despite the fact that there is a slight reversal, but because the median filters out insignificant signals, it skipped the signal and instead continues to depict purple.
Question 6 - Open two demo trades, long and short, with the help of a median indicator or combination that includes a median indicator (screenshot required)
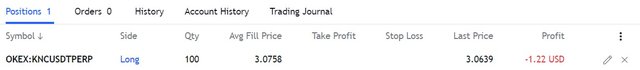
Long Position - For my long trade, I will trade the KNCUSDT market once I see the median indicator provide a green result and the price is moving over the Median line.
After receiving the buy entry signal, I set a stop loss below my entry and placed a purchase order for 100 units at the entry price of $3.07.
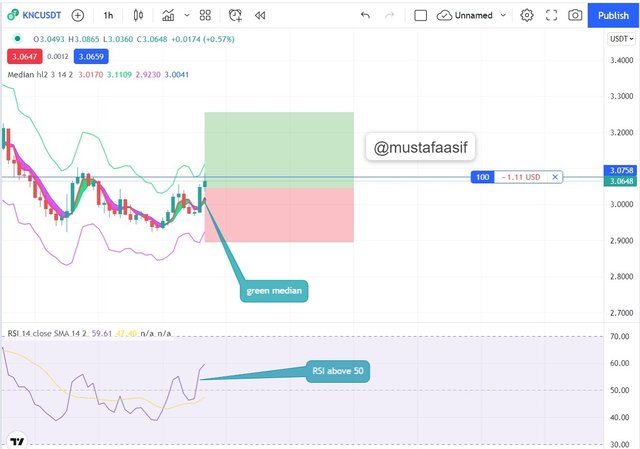
The image below is evidence of my trade.
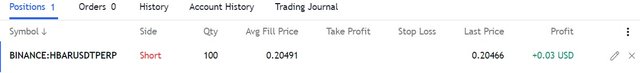
Short Position: - For my short trade, I will trade the HBARUSDT trade after seeing the median indicator display a purple result and the market moving underneath the Median line.
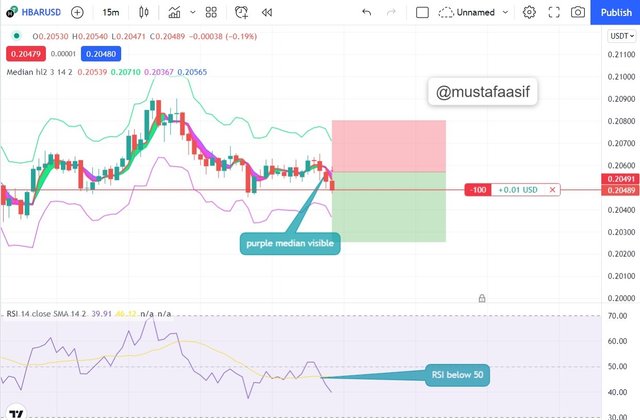
After receiving the signal for my sell entry, I put a stop loss above my entry and placed an order to sell HBAR for 100 units at the entry price of $0.20491.
The picture below exhibits evidence of my trade on the demo account.
CONCLUSION
Here is my conclusion to the article "Trading Strategy with Median Indicator," in which I described the fundamental understanding required before using the indicator.
The Median indication is a moving indicator because it tends to offer a smooth signal owing to its degree of filtering faulty market signals or unnecessary market information. The indicator is depicted using colours, as it indicates buy when the median line is green and sell when the median line is purple.
The Median indicator is best used in conjunction with other chart patterns such as the RSI indicator and others, since it cannot be utilized as a solo indicator owing to over smoothing, which causes the indicator to produce late or misleading signals at times.
I'd like to thank professor @abdu.navi03 for his thorough explanation; I keep hoping to see you in next class.
#abdu-s6week4 #cryptoacademy #club75 #steemexclusive #pakistan #median #indicator