Leverage with Derivatives Trading Using 5 Mins Chart - Steemit Crypto Academy S6W1 - Homework Post for Professor @reddileep
Hello there, Steemians. I'd like to welcome everyone to the first week of Season 6 of the Steemit Crypto Academy. I'm excited to be a part of Professor @reddileep's class on Leverage Trading of Derivatives Using the 5 Minute Chart. Leveraged trading is one of the efficient techniques of trading in the financial market that has enabled traders to participate in trading activities regardless of their money. Leveraged trading is also a high-risk strategy that can result in a total loss of trading money. As a result, in order to earn from leverage trading, a trader must employ a competent trading technique.
.png)
Understanding Leverage Trading
Trading has become more accessible in recent years, allowing anybody to engage. There is currently no restriction to the amount of trades you may purchase regardless of account size. Traders may be able to acquire assets worth ten times their money. Leverage trading is a sort of trading that allows customers to increase their purchasing power in the market while investing a little amount of money.
Leveraged trading allows consumers to buy assets using borrowing funds given by the exchange platform or broker. While traders' predictions are true, this provides a significant edge for them to generate greater income trading cryptocurrencies with minimal cash. However, when the market goes against your prediction, it may be disastrous in leveraged trading. If you do not deposit enough money to cover your losses, your account may be forced to liquidate.
Leveraged trading is not for inexperienced traders who lack a solid understanding of technical analysis. Leveraged trading is intended for experienced traders who understand the risks associated with the trading method. Trading with leveraged funds also requires strong risk management in order to ensure a great trading trip.
In the following sections, we will look at a trading technique that we may use to boost our trading performance while using leveraged money.

Benefits of Leveraged Trading
Leveraged trading is advantageous for cryptocurrency users who wish to engage in the financial market but have limited finances. In this part, we will examine the advantages of leveraging trades.
Leveraged trading enables customers to increase their purchasing power while investing a little amount of money. Users can utilize their trading funds to acquire assets here. This means that a trader with only $10 in capital may initiate a trade position worth $1000. This is the capability of leveraged trading.
Users that employ leveraged trading may make enormous gains while trading cryptocurrencies with little cash. We feel the crypto market has a lot to offer, but traders aren't always taking advantage of it owing to a lack of finances. Leveraged trading has allowed traders with limited money to capitalize on the market to earn.
Leveraged trading allows traders to diversify their investments across many assets. Because of their enormous purchasing power, traders may open many positions on various assets, allowing them to manage possible risks rather than placing all of their trading cash for one holding.
"Whenever the market turns against our prediction, leveraged trading allows us to protect our account. Traders can use tools such as cross margins to add extra cash to their bets here. This will assist to shield them against the possibility of liquidation.
Trade pressures also enable customers to manage their holdings while they are profitable or losing money. Users can close their traders in partials when they are in profit or loss before ending the entire argument.
Leveraged trading is most commonly used in scalping, when traders seek to earn rapid profits in a short period of time. A scalper may generate significant profits with a brief price change using leverage trading.
Disadvantages of Leveraged Trading
We explained the benefits of leveraged trading in the preceding chapter, and it seems so appealing that you want to start with a 1000 margin. Let's take a look at the drawbacks of this trading technique.
Leveraged trading is a high-risk trading strategy. When things go wrong in the market, a dealer is prone to losing his whole trading money.
When using leverage, a trader's position is at danger of being liquidated if there are insufficient money to pay the losses.
Leveraged trading entails a slew of trading costs, as well as expenses for holding deals overnight. This differs from spot trading, where there are no fees and no costs for keeping your coins for as long as you desire.
Leveraged trading is not suitable for inexperienced traders who lack expert understanding of technical analysis and risk management. To earn from this trading strategy, a trader must be proficient in forecasting future prices. So, even with a little amount of funds, leveraged trading is out if you don't have professional trading knowledge.
Basic Indicators for Leveraged Trading
Leveraged trading is a dangerous sort of investment, especially in the volatile cryptocurrency market. Before making any investment selection, a trader must know all of the essential pricing data. The most basic indicator a trader should look for before entering a position is the detection of trends. This will allow you to hunt for trading chances in the trend's direction. We may use only appropriate trend-based signals for this aim, such as the Exponential moving average (EMA), Parabolic SAR, Supetrend, Moving average convergence divergence (MACD), and so on. Let's take a closer look at some of these indications.
Parabolic SAR
J.Welles Wilder created the parabolic SAR as one of his leading indicator signals. In an uptrend, the hyperbolic SAR is primarily utilized to determine market direction and reversals. The parabolic SAR may also be used by traders to identify buy and sell indications inside the marketplace.
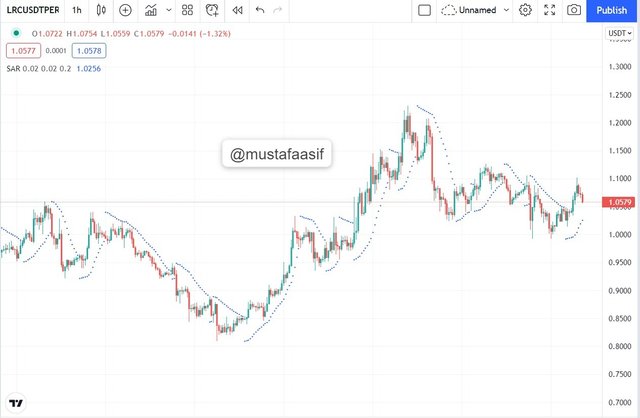
The parabolic SAR is visually depicted on the chart by dots that advance into the future and alter in response to price fluctuations. When the dots come above the price, it indicates a negative trend and a chance to seek for a sell position. Similarly, when the dots come below the price, it indicates an upswing and a good time to consider a buy position.
Moreover, whenever the dots change from bullish to bearish, it signals a trend reversal. The chart below depicts an example of Parabolic SAR with its default parameters.
Exponential Moving Average (EMA)
The EMA is another basic indicator that may be used in leverage trading to identify market patterns. The EMA was created to correct the latency in simple moving averages by assigning higher weights to contemporaneous price data points. The EMA is used to identify possible market trends, and it reacts to current prices faster than the basic moving average.
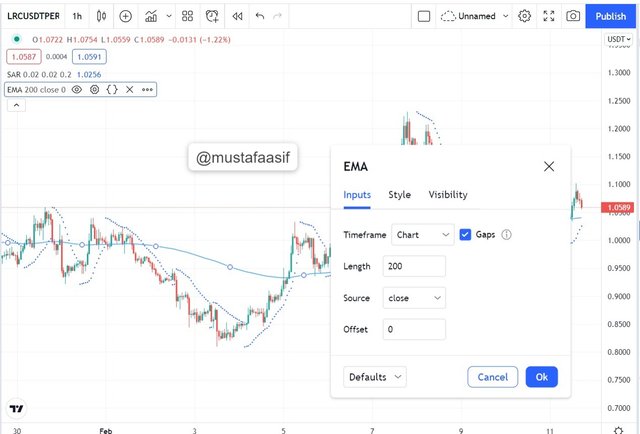
Whenever the price falls below the EMA, it indicates a bearish trend and a good time to seek for a sell position. Similarly, when the price is trading above the EMA, it indicates a positive trend and a good time for traders to seek for a buy position. Furthermore, the crossing of the EMA line above and below the price indicates a key market change.
The EMA with a period of 200 will be added for the purpose of the leveraged trading strategy in this research. This will take into account price data points from the last 200 days. The trader can customize the EMA colour to suit their trading strategy. The chart below gave an illustration.
Relative Strength Index
Another basic indicator that may be employed in leveraged trading is the RSI. The RSI is a volatility-based indicator that may be used to confirm trend reversals for the Parabolic SAR and EMA. The RSI calculates price volatility by identifying excessive and depressed areas.
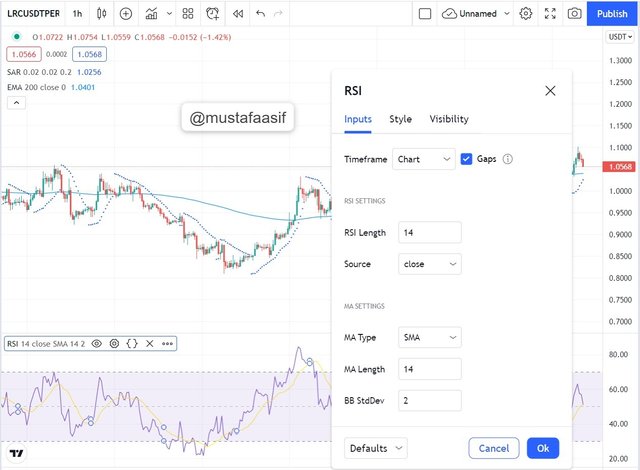
The RSI may be used to detect price reversals. When the RSI reaches an overbought level (over 70), it indicates weakness and weariness in the upswing. At this moment, the price is projected to reverse. Similarly, when the RSI falls below the 30 mark, it indicates weakness and weariness in the current decline. At this point, price is projected to revert to the upside.
When paired with the Parabolic Sar and the EMA, the RSI information may be utilized to more confidently hunt for buy and sell trade situations.
On the chart above, an example of the RSI is presented. We'll be changing a couple things in the style menu. We'll be unchecking some of the extraneous options that aren't required. Among them are 'RSI-based MA,' 'Upper Bollinger Band,' 'Lower Bollinger Band,' 'RSI Upper Band," and 'RSI Lower Band.' The RSI's background colour and middle line may also be customized to reflect a trader's trading style.
Special Trading Strategies for Performing Leveraged Trading
In this part, I'll go through a unique approach for leveraged trading. This method will necessitate the use of Heikin Ashi Charts to filter and level out market patterns. In addition, the 5mins chart will be used in this technique.
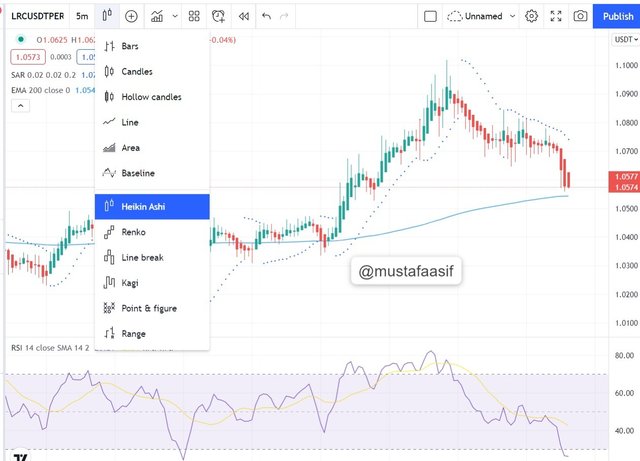
Looking at the chart above, we've transformed it to a Heikin Ashi chart and set the period to 5 minutes.
Buy Position Strategy
The EMA is the first item to check at when determining trend direction. If the price is trading above the EMA, it indicates an uptrend and a good time to purchase. The trader should consider a **Buy position in this case. Second, we'll take a look at the Parabolic SAR indicator. In the previous part, we stated that if the Dots are below the price level, it indicates a bullish trend and we only seek for a Buy position.
The RSI indicator provides the ultimate proof. The RSI indicator is used to corroborate purchase indications generated by the Parabolic SAR and the EMA. If the RSI falls below the middle line, we may confirm the purchase position (Below 50 threshold). Furthermore, buying long with the RSI below 20 amplifies the signal and improves the likelihood of the purchase position being profitable.
Please keep in mind that the three indications must all be in sync before considering a purchase position. The chart below shows one example of this.
On the BTC/USD chart, we discovered a buy trading strategy **using the chart above. To begin, we can observe that the price is trading above the 200 EMA, indicating a positive trend. Also, I noticed that the **Dots were trading below their price, which provided me a buy trade signal. Finally, I examined the RSI and discovered that it is less than 50. This is an excellent indication to go long on the Buy.
This position's stop loss can be placed in one of two crucial locations. The first location might be below the 200 EMA, while the second could be below the Dots. Take profits for this trade may be noticed when the dots appear above the price, indicating that selling pressure has entered the market.
Sell Position Strategy
This section will go through the Sell Position Strategy for taking advantage of a Sell Short opportunity. When the parabolic SAR begins to indicate Dots above price, we may take a sell short position. In addition, for a prospective sell short position, the EMA should be trading above the price. Finally, the RSI is utilized to corroborate the sell short signal generated by the parabolic SAR and EMA. Before you sell short, make sure the RSI is above or close to 50. A reading of the RSI over 70 intensifies the sell short signal. The chart below provides an example.
All of the sell short setups outlined above may be seen in the chart above. The dots and the EMA are trading above the price. Furthermore, the RSI is above 50, confirming the sell short position. Stoploss for this trade might be set lower than the 200 EMA or lower than the Dots. The take profit for this trade is noticed when the parabolic SAR dots appear below the price.
Performing a Real Leveraged Trading
In this part, I will use the leveraged trading approach outlined in this post to do technical analysis on a cryptocurrency pair. This analysis will be performed on https://www.tradingview.com/, and the trade will be conducted on the Binance exchange.
ADA/USD: 5 minutes Chart
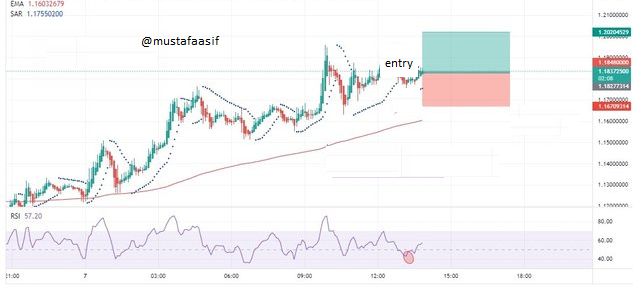
Looking at the chart below, I noted that price is trading above the 200 EMA, indicating a bullish trend and a chance to buy long. In addition, the parabolic SAR began to display dots below the price, indicating a long buy position. I eventually went to the RSI for confirmation because it was below the 50 threshold. On the Binance exchange, I placed a buy long trade on a leveraged account with a cross margin of 2.
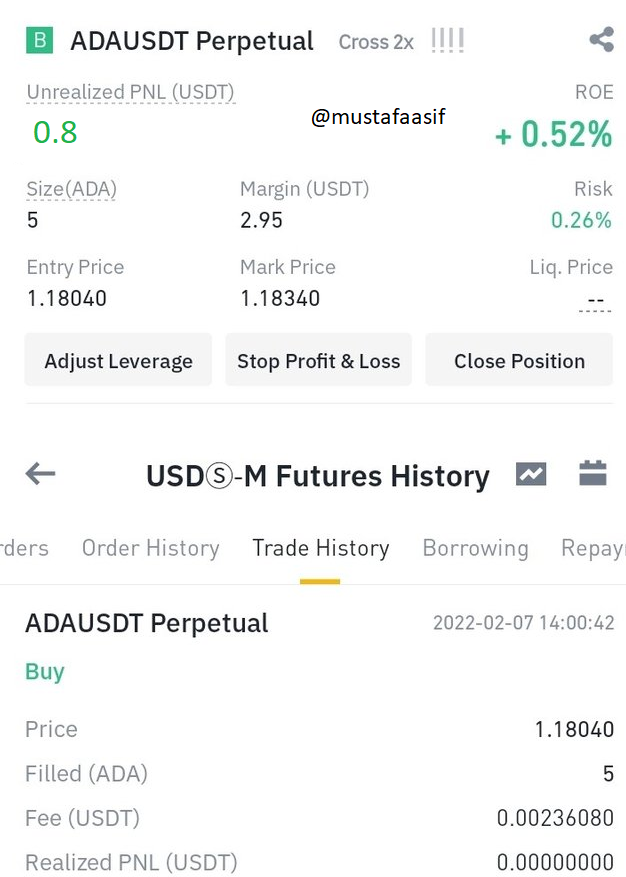
The transactions on the Binance exchange are shown in the screenshot above. I will use the appearance of parabolic SAR dots above price, as mentioned in this post, as an exit option. That will be the aim for the take profit.
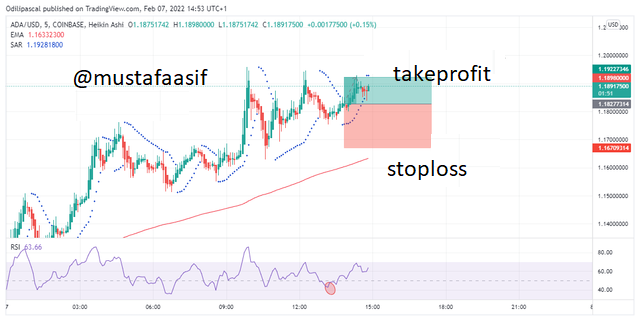
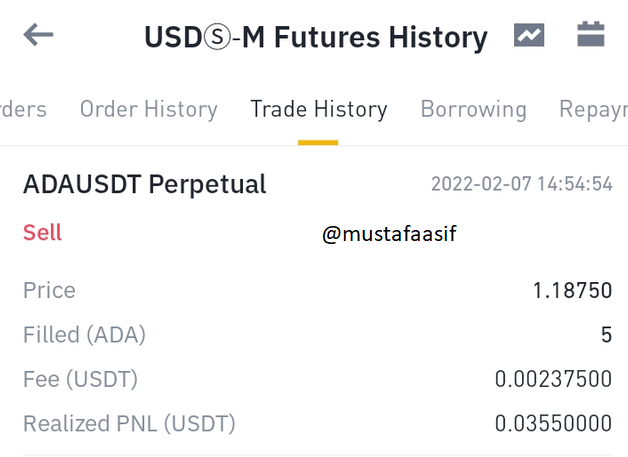
After a while, I observed that the parabolic SAR DOT has risen above the price. This indicated a negative price reversal. I took gains and closed my investment at a loss.
Conclusion
Trading cryptocurrency is extremely dangerous, especially when using leverage. We addressed leveraged trading and its benefits to traders in this paper. We've also discussed the drawbacks of leverage trading. In addition, we highlighted a unique trading approach that traders may employ to make sound investment selections while trading with leverage. This comprises using parabolic SAR, EMA, and the RSI in conjunction.
Every trading strategy has the potential to fail, and there is no assurance that the market will move in your favor. I highly advise traders with professional expertise of technical analysis and risk management to use leveraged trading. Leveraged trading offers appealing rewards that may cause traders to disregard the hazards associated with trading with leverage. This study, I feel, will serve as a guide for making sound investing judgments in leverage trading. Finally, while trading leveraged, always invest only what you can afford to lose and employ risk management effectively.