Crypto Trading with Moving Average - Crypto Academy |S6W2| - Homework Post for Professor @shemul21
Hey , Steemians. Hello and welcome to the second week of Season 6 of the Steemit Crypto Academy. Professor @shemul21 conducted today's class on Crypto Trading using Moving Averages. Moving averages are a technical indicator that is employed by nearly every trader in the market today. Moving averages are important in technical analysis nowadays because investors rely on them to make effective trading decisions in the marketplace.


Understanding Moving Averages
Technical indicators are among the industry's chart analysis instruments, acting as a trading signal to investors or as a signaling verification instrument to those other basic research tools. The rolling average is a leading indicator technical indicator that is useful in determining price direction. The moving average is used by traders to measure the current market price as well as possible trend reversals when price goes along each moving average.
The moving average is generated by plotting the average price over time using a mathematical formula of pricing data sets. This moving average exhibit received good feedback detecting buy and sell signals in the market by filtering current price variations. A 200 moving average takes into consideration the actual average price ranges over the last 200 days. Let's have a peek at a moving average example on the chart.
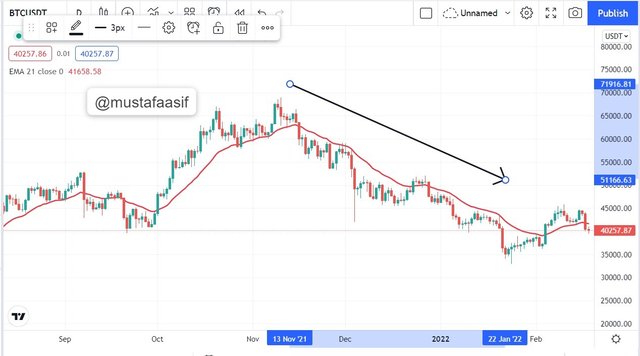
We have included the 21 movements on the chart to the graphic below. We can see by the chart that the moving average aided in determining the current market price. According to the chart, the price is now trading below the rolling average, indicating that it is in a downturn. Apart from recognizing patterns and signaling data, the moving average also acts as active support and opposition, indicating potential price reversion points in the future.
Different types of Moving Average
For signal information, technical analysis use some price data points in their calculation. The moving average follows the same logic. There are numerous moving average signals available in technical analysis nowadays. The main distinction between such moving averages is the variables and data sets included as during calculation. We'll look at the three most popular and effective moving averages in the market.
Simple Moving Average (SMA)
The basic moving average is the most basic sort of moving average. The basic moving average considers the average cost of a coin over a period of time. The basic moving average shows the genuine average cost over a certain time period. As the price swings, the moving average is shown constantly. Let's have a look at the formula for computing the simple moving average.
SMA = (A1 + A2 +...+An) / n
Where A is the average price data points for a certain time period.
n = Number of periods taken into account ( e.g 200 day periods)
Exponential Moving Average(EMA)
Because of the latencies in the simple moving average, the EMA was created. However the SMA and EMA are both moving averages, the EMA is a more sophisticated moving average that lends greater weight to recent values. The EMA's goal is to create a moving average that responds to recent price fluctuations more quickly. The EMA is important for short-term traders since it provides them with the most recent price information in the market. Aside from the SMA, which lags behind the price, it is difficult for traders to receive timely price cues. The SMA and EMA are both useful for making successful trading selections since traders may use them together to acquire both long-term and short-term price information. The EMA calculation formula is as follows:
EMAc = [ Cp × (s/1+n)] + EMAp × [1 - (s/1 + n)]
Where ;
EMAc = Current EMA
Cp = Current price
EMAp = previous day EMA
s =Smoothing factor
n = Period (number of days)
Weighted Moving Average (WMA)
Balanced moving average is based on the premise that data about the current market price is more relevant than data about the prior day's price. The SMA and EMA pay more attention to prior data points. Meanwhile, the WMA assigns greater weight to recent data points, causing the indicator to respond to the current price more quickly. The WMA is excellent for short-term traders since it reacts faster to minor price movements in the market. The WMA is determined as follows:
WMA = (Price1 × n + Price2 × (n-1) +...Pricen)/ [ n × (n+1)/2]
n = Period(number of days)
Difference Between EMA, SMA and WMA
In this part, we will look at the differences between the SMA, EMA, and WMA to help traders grasp the benefits of each and then choose the best one for their trading style.
| SMA | EMA | WMA |
|---|---|---|
| SMA considers the average cost of a coin over a period of time. | The EMA considers the current price as well as a factor for flattening. | The WMA considers the most current price data point while disregarding the prior piece of data. |
| The SMA is appropriate for long term trading strategy as it lets plays an important part average price to discover long term trends | The EMA is useful for short-term trading methods since it reacts quickly to small price movements and may also be used to detect reversals. | The WMA is more price conscious since it looks for price indications in recent data. This is excellent for a scalp trading approach. |
| A high-value SMA is more likely to produce accurate signals. This is due to the fact that lengthier price data points are computed in order to produce a transmitted signal. | As the indicator adds weight to the most latest price for signal, an EMA with a lesser value is believed to be more dependable. | The WMA is consistent at both high and low levels. This is due to a greater emphasis on the most current pricing. Even at greater values, the most recent price is given more weight. |
| The SMA lags behind the price. | The EMA responds to price changes more quickly. | The WMA is more sensitive to small price changes. |
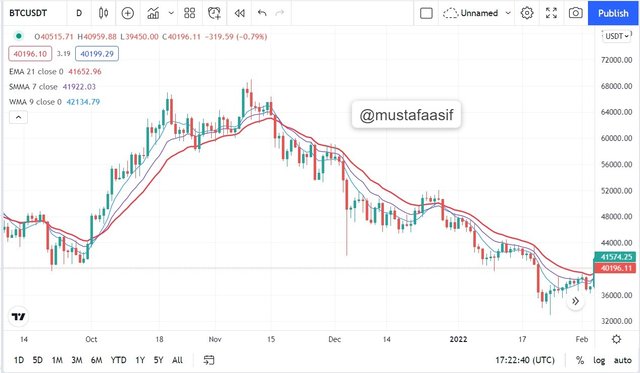
The difference between the three moving averages may be seen in the chart below. The WMA is visible closer to the price because it reacts faster to minor price changes. Furthermore, the SMA is moving away from the price. Although the SMA lags behind the price, it is valuable for long-term traders. The EMA, on either hand, appears to be closer to price as a result of the smoothing applied to the most recent price in its computation, allowing it to respond to price fluctuations more quickly.
Identifying Entry and Exit Points Using Moving Average
The moving average is critical in determining market departure and entrance locations. To demonstrate how we may use moving averages to find entry and exit locations, I shall combine two moving averages. The SMA (50 periods) which indicates the average price data points will be utilized to identify the direction of price. The price is observed trading above the SMA during a strong rally. At this point, we can seek for a buy position by descending to the EMA (20 periods). The EMA is utilized in this case because it responds faster to price and also shows the involvement of market participants.
In the last portion of this piece, we discussed how the moving average may be used to provide dynamic support and resistance. Price retraces down to the moving average to find support during a strong advance. Following that, a buy position may be taken when the price reverses up after being rejected by the moving average. Let's have a look at the graph below.
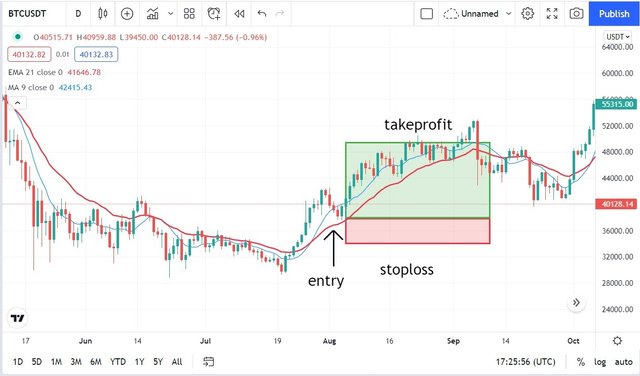
The price retraced back to establish support on the 20 EMA following the trend reversal from bearish to bullish, as shown in the chart above. Following that, a bullish engulfing candle can be used to perform a bullish entry position. The stop-loss for this position might be set below the 100-day moving average. The rationale for this is that if the price falls below the 100SMA, it suggests a bearish reversal, which favors the purchase position.
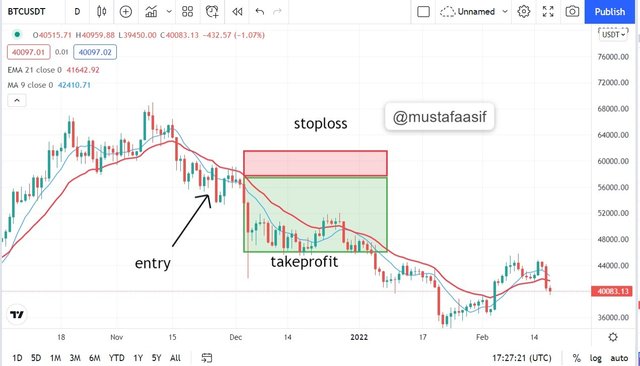
The two moving averages are above the price in the chart above, indicating that the market is in a decline. In this case, we seek for a sell entry when the price encounters resistance at the 20EMA. This is shown on the chart above, as the price has retraced back to the 20EMA. After a bearish engulfing candle, an entry position can be spotted with a stop loss put above the 100SMA.
Moving averages are powerful technical analysis tools that can be used for more than just identifying trends. The indicator also aids in identifying market entrance and exit points. In this segment, I employed the 20 EMA as well as the 100 SMA. This is my favored setting for the time being because it corresponds to my trading approach.
Understanding Moving Average Crossover
Moving average crossing is a strategy for profiting from trend reversals by combining two moving averages. This will most likely be a slow and quick average. Because it only uses a few data points in its computation, the fast-moving average reacts to price changes quickly. The slow-moving average, on the other hand, reacts to price more slowly since it relied on price data points from a wide number of days in its computation.
Whenever the quicker moving average passes above the slower moving average, it indicates a trend reversal and a buying opportunity.
Likewise, whenever the faster exponentially weighted moving passes below the slower moving average, it indicates a bearish reversal and a good time to sell. On the BTC/USD chart below, I've blended a fast-moving average (20 EMA) with a slow simple moving average (SMA).
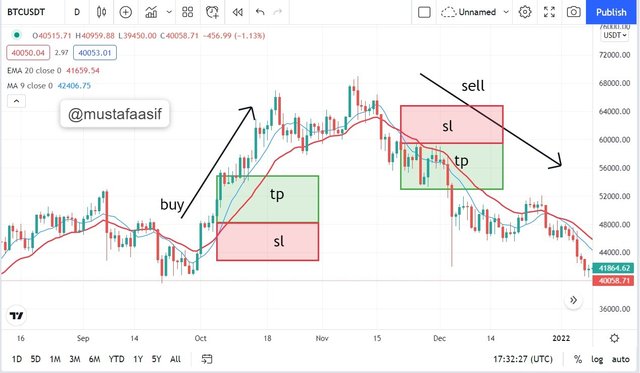
The crossover of the faster moving average above the slower moving average can be seen in the chart above. As we observed prices trending higher, the crossover signaled a trend shift from negative to positive. After the breakout candle, a solid entry opportunity with a stop loss put below the slow moving average can be found.
On the very same chart, the price broke the quicker moving average after the cross that started the bullish trend, indicating exhaustion and a reversal of the bullish trend. The crossover of the fast-moving average below the slow-moving average confirms the bearish reversal. After the breakout candle below the fast moving average, a sell position can be taken with a stop loss put above the slow moving average.
While the crossover is a fantastic approach for getting an entry during a reversal, keep in mind that it only works in a moving market. In a sideways market, moving average crossings might provide erroneous price information, resulting in losses. In addition, the design of the fast and slow moving averages is determined by a trader's approach. Scalp trading will use shorter periods, such as the 9 EMA for rapid moving averages and the 21 EMA for slow moving averages. It all comes down to your trading technique.
Limitations of Moving Average
In this research, we discussed crucial moving average data and about how we might utilize the moving average to discover helpful trading signals. Technical indicators are unreliable and, as a result, might produce erroneous indications in the market. A technical indicator should not be used as a hold trading system. Let's take a look just at moving the average indicator's limitations.
Moving averages are calculated using price history data points. Other price information and fundamental variables that may impact the price are not taken into consideration by the indicator.
Because it considers previous price data points, the moving average is a lagging indicator. As a result, the indicator may prompt traders to initiate a position after the price action has indeed happened.
The moving average is affected by the time period utilized. Whenever a trader chooses a period in the incorrect timeframe, it might result in a misleading trading signal in the market. For example, a bullish trend in the 9EMA may be misleading in the 20EMA.
In a price movement, the moving average works best. The moving average does not function effectively or provide any meaningful pricing data throughout a downward market.
Conclusion
In today's financial market, technical indicators are effective technical analysis tools. We've spoken about the moving average and how we can utilize it to get relevant pricing information. We've also highlighted the moving average's limitations to assist you realize the hazards of depending on the moving average for trading recommendations.
Chart patterns may trail or follow the market cost. This means that they do not provide current valuation movement based on past data points in their computation. To filter out any erroneous indications first from indication, it is best to combine the moving average with other technical analysis tools. Finally, the cryptocurrency market is extremely volatile and can result in the loss of all capital. Supports effective risk management in all market trading decisions.
Thank you very much, @shemul21, for this fantastic moving average lesson.
#cryptoacademy #shemul21-s6week2 #club75 #steemexclusive #pakistan #movingaverage #indicators
@shemul21
@steemcurator02
Check your numbers - you do not currently qualify for #club75.