Crypto Trading Using Zig Zag Indicator - Steemit Crypto Academy - S6W1 - Homework post for @kouba01
Hello there,
It's the first week of Season 6, and I'm pleased to be one of those working in the academy this season. Today, after going through professor @kouba01's lecture on the topic of Crypto Trading Using Zig Zag Indicator, I shall tackle the homework exercise assigned by the professor to demonstrate my grasp of the course. Let's get this party started.
.png)
1. Show your understanding of the Zig Zag as a trading indicator and how it is calculated?
Each investor in the crypto market looks for the trend's direction in order to make better trading decisions. Identifying the trend in any crypto currency pair is critical because it allows traders to trade with the trend rather than against it (counter trade). The Zig Zag indicator is one of the indicators that many traders use to determine market trends.
The Zig Zag indicator, as the name suggests, is a sort of indication that is zigzag in character, which means that perhaps the lines for this indication is just not horizontal and moves up and down in response to big price activity. The indication is used to join the maximum and minimum points on a chart.
As stated in the preceding paragraph, the indicator is only interested in big is about on a chart, and as a result, every small movement or price fluctuation is always disregarded by the indicator. This is because the indication aids in the elimination of fake out, which may appear as the reason of the motion. Before proceeding, the zigzag indicator waits and validates this movement.
The Zig Zag indication has aided in the detection of the five points that are typically difficult to detect in the Elliott Wave. The Elliott wave theory, as we all know, is composed of explosive waves and correcting waves, and identifying these points might be tough for a novice trader, but employing the zigzag indicator makes it much easier and simpler.
How it is calculated
The above factors must be considered while computing the Zig Zag indicator, as well as the type of chart used. In the case of a line chart, for example, just the closing price is considered, however in the case of a bar chart or candlestick chart, the lowest and maximum price are included.
The variation in the indicator, which shows the proportion of price fluctuation, is what causes the line displayed on the chart. As a result, the final deviation in the chart is always ignored because it is still being worked on. The prior deviance is used in the computation.

2. What are the main parameters of the Zig Zag indicator and How to configure them and is it advisable to change its default settings? (Screenshot required)
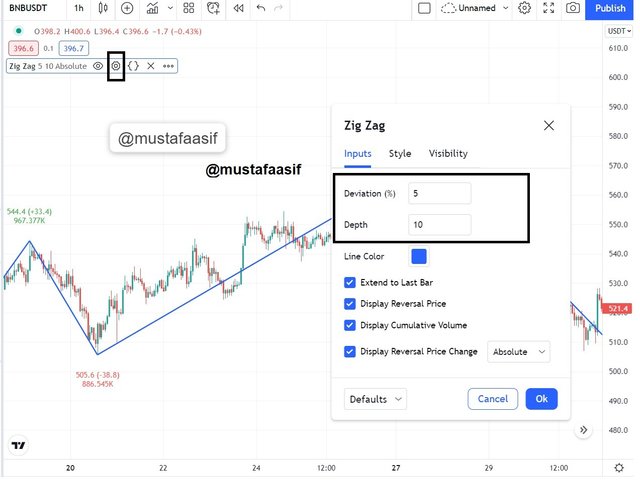
On my chart, the zigzag indicator is seen in the image below. This indication was put to the chart initially so that I could tweak it. The chart was obtained from the tradingview website.
As you can see in the chart above, we have two key parameters from the settings option: deviation (percent) and depth. The deviation value is normally set to 5 by default, while the depth parameter is set to 10.
Deviation: The deviation specifies the percentage difference between the chart's minimum and highest points. The zig zag line on the chart is drawn in this manner. The deviation is normally set at 5 by default, although this may be modified.
Depth: The depth is the distance travelled for yet another deviation on the chart to occur. The depth is normally set at 10 by default, however this may be adjusted.
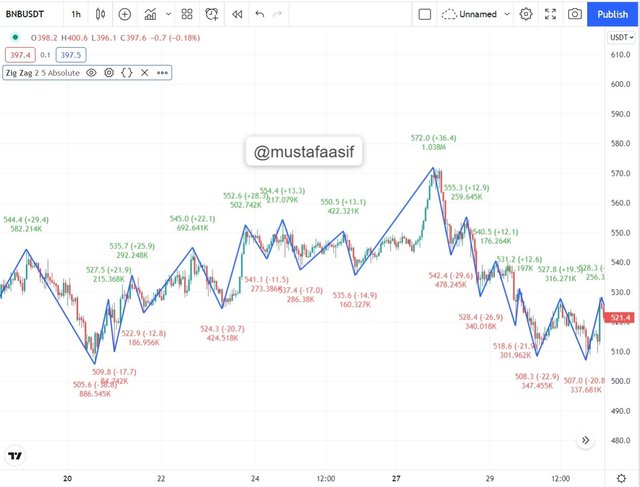
As I previously said, while selecting your indicator, you can simply adjust the default values for both deviation and depth to whatever figure that matches your trading approach. As an example, I'll change the values of my deviation and depth to 2 and 5, respectively, to observe how the chart looks. Take a look at the image below.
We can see from the image above there are a lot of clusters in the chart, and it may be difficult to trade with this since the volatility has grown quite high. Changing the default option, in my view, should be done only by traders who are extremely knowledgeable with the approach and must be a pro when it comes to trading, not by newcomers to the crypto world. So, unless you're an expert, I recommend sticking with the default settings.

3. Based on the use of the Zig Zag indicator, how can one predict whether the trend will be bullish or bearish and determinate the buy/sell points (screenshot required)
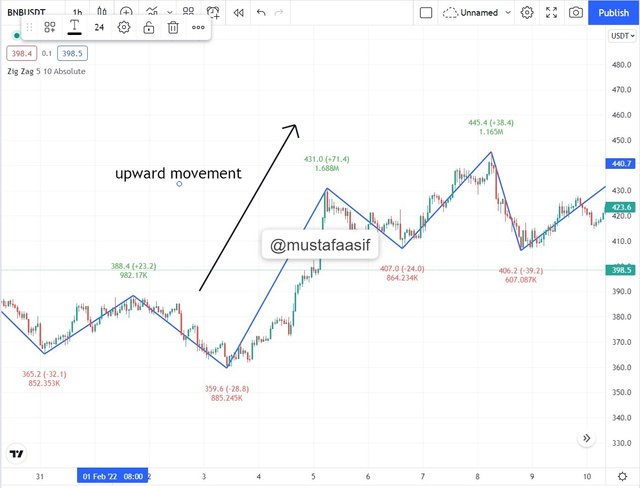
Because the zig zag indicator is a trend indicator, determining a trend with it is simple and straightforward. In the case of a bullish trend, we witness a series of peaks that are higher than the previous high, and a series of lows that are higher than the previous low. This movement shows that the market structure is in an uptrend or bullish trend. The graphic below shows an illustration of this.
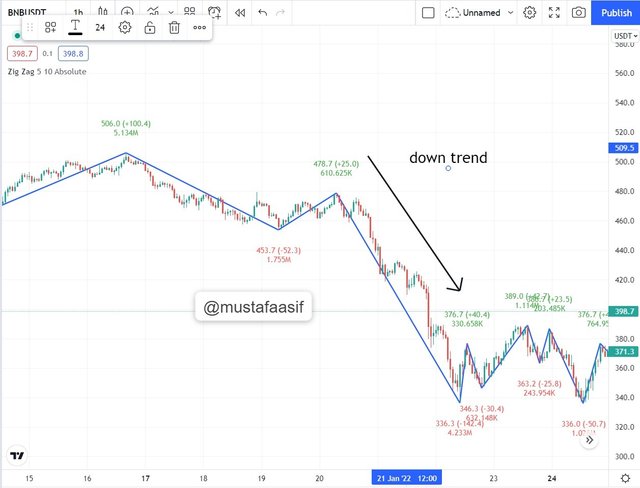
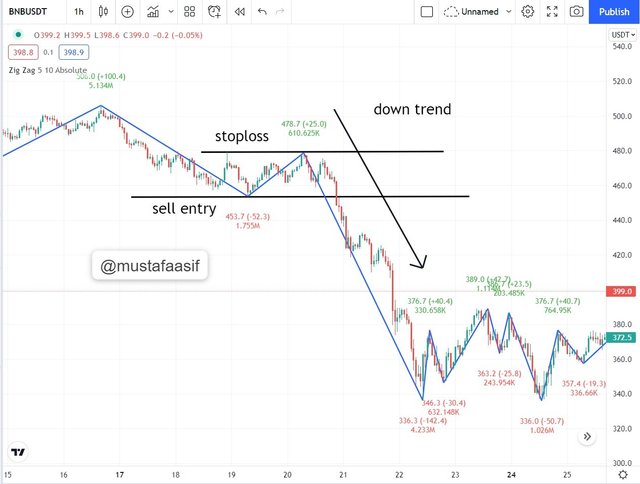
Similarly, the movement in a negative trend is downward and inverse to the movement in an upswing. The new low is lower than the prior low and the new high is lower than the previous high in this case. The presence of a downturn or negative trend in the market structure is confirmed by this movement. The graphic below shows an illustration of this.
Determining Buy/Sell Point Using Zig Zag Indicator
As I previously stated, it is usually advisable that a trader understands the trend direction before placing an order. A trader who does not know the direction of a trend will execute a counter trade, or trade against the trend, which is an extremely risky sort of trading. When placing a purchase order, traders should always do it when the market is moving in a bullish or up trending manner. Similarly, when placing a sell order, traders should do it when the market is going in a negative or downward direction.
Buy Point
When it comes to purchase points, they should be placed when the market is in an upswing. In this case, a buy order may be placed at the point where the current low is higher than the prior low, and a stop loss can be placed just below the entry point, which is the newly formed low. The screenshot above describes it in further detail.
The entries are made soon after the low, which is higher than the previous low, and the stop loss is placed exactly underneath the point of entry, which is a support level for the trade, as seen in the image above.
Sell Point
When it comes to sell points, they should be placed when the market is in a decline. In this case, a sell order may be placed at the point where the current high is lower than the prior high, and a stop loss can be placed immediately above the entry point, which is also the previous high. The screenshot above describes it in further detail.
When the market is trending downhill, an entry is made right after the peak, as shown in the screenshot above. And the stop loss is set above the entry point, which is also a resistance point.

4. Explain how the Zig Zag indicator is also used to understand support/resistance levels, by analyzing its different movements.(screenshot required)
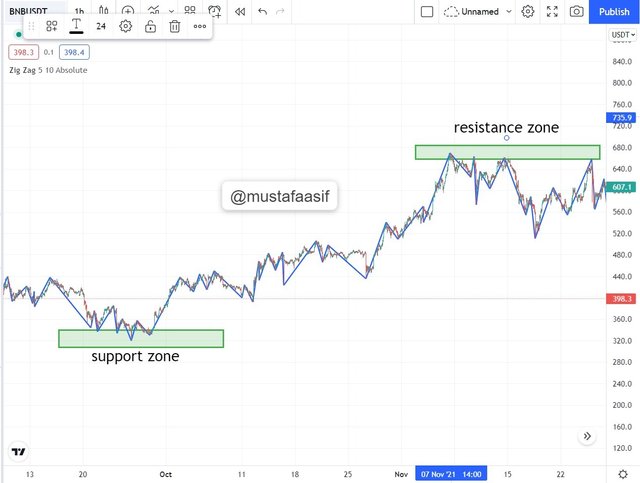
The Zig Zag indicator, like any other, may be used to identify places of support and resistance. It is vital to note that points of support and resistance are levels at which the asset's price will reach and then rebound back. I.e., the price does not cross these thresholds since it is compelled to reverse to the other direction at these places. Consider the image below.
The points marked as support and resistance levels on the chart can be seen in the screenshot above; these are levels where the price can no longer go downward or higher, as the case may be. The zig zag indicator demonstrates how the price at this point bounces and eventually reverses since it cannot advance any farther. In essence, the levels of support are the levels of accumulation, while the levels of resistance are the points at which dispersal occurs. The price is pushed upward by the support level, i.e. the zig zag indication is pushed upward by the resistance level, and the price is pushed lower by the resistance level.

5. How can we determine different points using Zig Zag and CCI indicators in Intraday Trading Strategy? Explain this based on a clear examples. (Screenshot required)
The purpose of combining the Zig Zag indicator with the CCI indicator is to be certain about the trend movement before making an entry. Essentially, the combination is performed to validate the trend and the moment at which we desire to join. The CCI indicator is used to identify overbought and oversold conditions in the cryptocurrency market. When the indicator is observed in a range more than 100, we say the asset is in an overbought zone; similarly, when the indicator is seen in a range less than 100, we say the asset is in an oversold region.
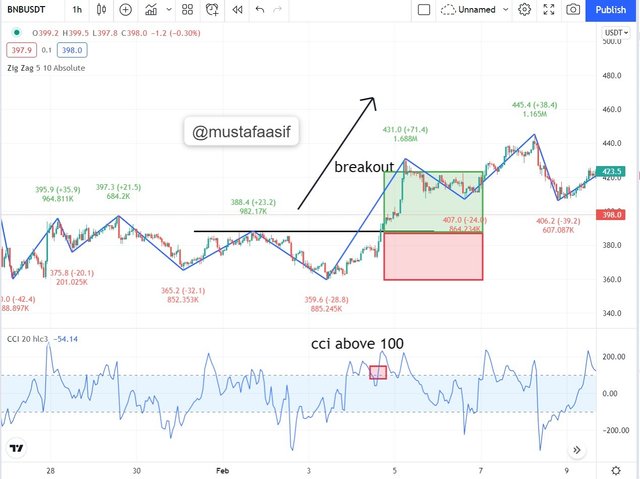
In the event of a buy entry verification using the zig zag and CCI indicators for trading stocks, the price must break over the prior resistance level and then go upward, and the CCI indicator must be above 100 to indicate that we are in a strong trend. To minimize excessive loss if the transaction does not proceed as anticipated, the stop loss should always be put below the prior resistance level.
The CCI indicator is observed above 100 in the figure above, confirming that the trend is strong, and the zig zag indicator shows the price breaching and advancing above the prior barrier.
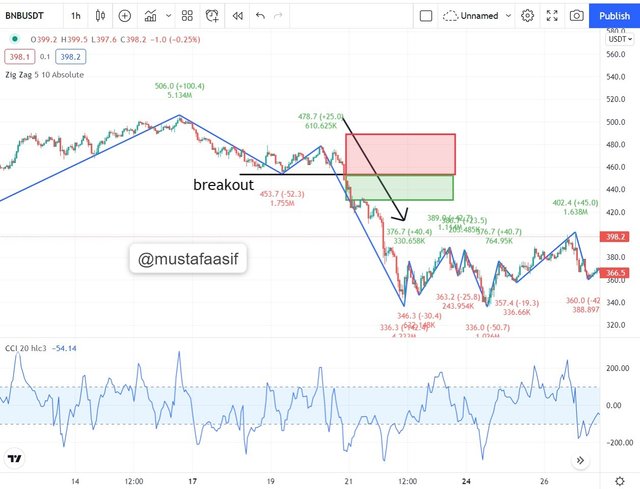
To establish that we are in a strong trend when using the zig zag and CCI indicators for intraday trading, the price must break above the prior support level and subsequently go downward, and the CCI indicator must be -100 or below. To minimize excessive loss if the transaction does not proceed as anticipated, the stop loss should always be put above the prior support level.
The CCI indicator is observed within -100 in the figure above, confirming that the trend is strong, and the zig zag indicator shows the price breaching and heading below the prior support.

6. Is there a need to pair another indicator to make this indicator work better as a filter and help get rid of false signals? Give more than one example (indicator) to support your answer. (screenshot required)
The importance of pairing indicators to improve this indicator's performance as a filter and assist eliminate false signals cannot be overstated. As we all know, no indication is 100 percent efficient, thus any trader looking for a more trustworthy answer must combine more than one signal on the chart. To validate my trend movement, I will use the Zig zag indicator in conjunction with the RSI and the ADX indicator. Let's get this party started.
Zig Zag Indicator and RSI indicator
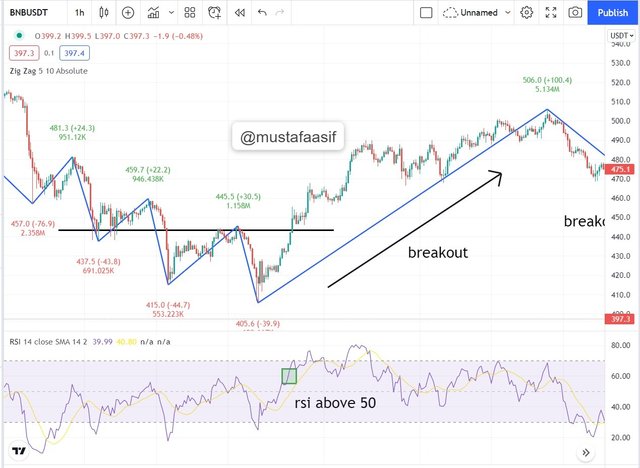
The RSI indicator is a technical indicator that tells traders whether an asset is overbought or oversold. When the RSI value falls below 30, the asset is said to be oversold. Similarly, when the RSI is more than 70, we say the asset is overbought. When placing a purchase signal, the zig zag indicator must be in an uptrend and the RSI indicator must be above the 50 RSI as a strong trend indication. Please see the screenshot below.
The price of the asset breaks over the prior resistance in the picture above, and the zig zag signal advances upward. The RSI indicator, on the other hand, is above 50, indicating a very strong trend. Before the entrance, the stop loss was set at the support level. When it comes to selling entry, the same rules apply, but in reverse.
Zig Zag Indicator and ADX indicator
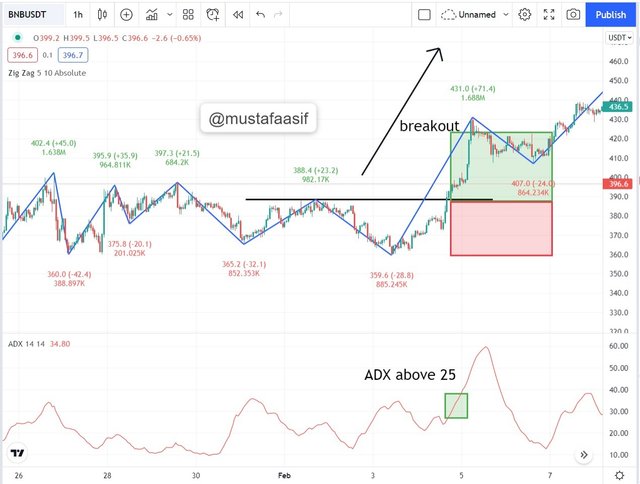
When used with the Zig zag indicator, the ADX indicator produces even better results. The indicator indicates how strong the market's trend is at any given period. When the ADX indicator is larger than 25, it indicates that the trend is strong up. So, similar to the previous example, when the price breaks the prior resistance and then continues upward as shown by the zig zag indicator, and the ADX value is more than 25, it indicates that a buy entry should be made at that moment since it is a strong position. Please see the screenshot below.
The price of the asset breaks over the prior barrier in the picture above, and the zig zag indicator advances upward. The ADX indicator, on the other hand, is above 25, indicating a very strong trend. Before the entrance, the stop loss was set at the support level. When it comes to selling entry, the same rules apply, but in reverse.

7. List the advantages and disadvantages of the Zig Zag indicator:
The Zig Zag indication, like any other indicator, has benefits and limitations. In this section, I will outline the benefits and drawbacks of this indicator in a tabular format below.
| Advantages | Disadvantages |
|---|---|
| The Zig Zag indicator assists traders in locating points of support and resistance on a chart. | Because of the unreliability of the results, the Zig Zag indicator should not be used in a short timescale. |
| The Zig Zag indicator provides traders with information about the market's prior history, allowing them to do better chart analysis. | The indication is difficult to understand, and it is nearly hard to utilize for individuals who are new to trading. |
| The Zig Zag indicator enables traders to readily identify price activity on a chart, allowing them to make more informed decisions. | The Zig Zag indicator, like all other indicators, is not perfect and so cannot be utilized as a stand-alone tool to make trading decisions. |

Conclusion:
The zig zag indicator is a very useful tool for any trader. It is significant because by simply glancing at the chart to which this indicator has been added, you will be able to determine the market's trend of the market. Though a number of flaws have been identified in the indicator, it is recommended that it not be used as a stand-alone tool; instead, it should be used in conjunction with other indicators for the best results.
Finally, I'd want to thank the lecturer, @kouba01, for such an interesting and educational lecture; I've learned a lot as a result of doing this assignment work. As the Academy proceeds, I want to learn even more from you, sir.
#kouba-s6week1 #cryptoacademy #club5050 #zigzag #krsuccess #pakistan

