HOMEWORK TASK SEASON 2 WEEK 6 BY PROF.@fendit ||ELLIOTT WAVE THEORY||
Hi steemians. How are you. I am fine and hope that you will also be fine.
Thankyou so much dear professor @fendit for your knowledgeable lecture.
1. What's the application of this theory?
There is a very vital use of Elliot wave theory (EWT) in financial understanding of market, some of them are explained follow:
• Mainly it is used to acknowledge the market trend of any asset, that, whether the coin is following the uptrend or down trend. So, to understand the whole scenario of the market, he (Ralph Nelson Elliot) introduce the Elliot wave theory. Basically this is analytical analysis the chart of any specific asset or coin. So, this theory is very important to predict the prices of assets.
• Because by using this theory, you can analyze the whole graph of any particular asset that gives you enough knowledge before you decide that whether you want to buy or sell that particular coin or not.
• And when you understand the whole market in a way that you can give prediction about any asset, so, I personally think that the full command on this theory can prevent a trader from loss. Furthermore, this theory has very vital role in understanding the pattern of the market of any asset.
2.What are impulse and corrective waves? How can you easily spot the different waves?
According to Elliot wave theory there are usually two types of waves generally named as:
• Impulse waves
• Corrective waves
As defined in the theory, if market trend moves upward it means that wave is called as impulsive wave and after that when market moves downtrend then it is called as corrective waves. And as defined in theory, there is a total 8 wave cycle followed, in which first five waves moves upward referred as impulse waves, while the three waves after that are referred as corrective waves which usually shows the downtrend of market after the impulse, as, According to Elliot wave theory.
Impulse wave:

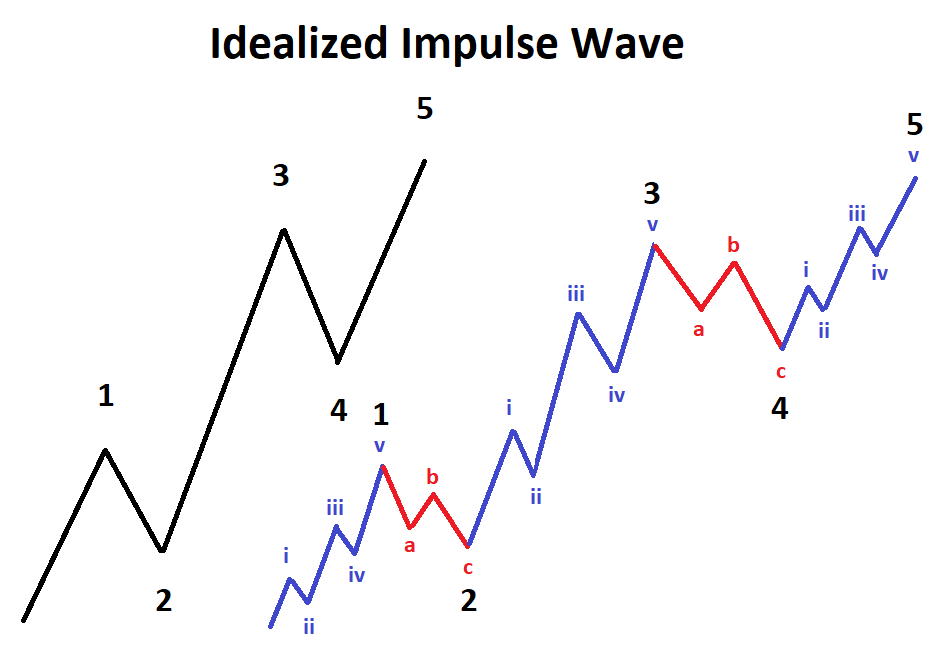
As shown in the graph, 1st wave is the beginning of the 8 wave cycle that is defined in Elliot wave theory, it shows that, there is clear rise in market.
There are some traders that sell their assets after the 1st wave by gaining a small profit, and, this may cause a little down in price shown as 2nd wave.
At the same time, there are many bullish buyers that started buying during the 2nd wave that appears in the form of big uptrend rise in value in the form 3rd wave. And in Elliot wave theory, it is defined that every time, 3rd wave is the largest wave in this 8 waves cycle.
And now after the 3rd wave, you can referred the scenario as 2nd wave, because, as similar as, the first wave some traders sold their assets which results in the form of little downfall in the value in the form of 2nd wave. Similarly, the same condition is applied here, most of the traders sell their assets after this major 3rd wave rise, this also results in a little downward of trend in the form of 4th wave.
The final and fifth wave of impulse waves, as shown in the graph, sometimes, some of the buyers, buy assets after 4th wave and this results in the rise of last wave referred as 5th wave.
Corrective waves:
After the five impulse waves, there are three corrective waves, which referred as A,B and C waves.
These waves generally shows the downtrend of asset which recently gained the peak as a result 5 impulse waves. So, according to technical analysis you can say that these waves moves in the opposite direction to the impulse waves.
And you can also classify the corrective waves as following:
Zigzag
These waves are in the pattern of zigzag, and there is main rule if the corrective waves are following zigzag structure then defiantly there will be the downfall in price of asset as it remains i.e B wave.
Flat
As almost clear by the name that these waves are flat waves. You can understand these type of waves as there is no major ups and downs in the value of asset as it remains the same, so, when the values remains means that there very little amount of traders who are almost equal in numbers, who are selling and buying the asset nearly of same budget, so, these waves are known as flat waves.
Triangles
According to experts, this type of corrective wave is very hard to spot and there is triangular like pattern, and this is very hard to predict, this means the there is fickleness and inconstancy in the value of asset.
How we can spot the waves:
According to experts, this is very difficult to spot the waves, as there are many ups and downs in the value of asset so it is very hard to spot that which wave is the 1st wave, which Sir Ralph Nelson Elliot introduces, but the experts have also devised some rules to predict that this is the first wave, so, it is not impossible to spot the 1st wave. Experts says that you can easily spot the first wave by comparing the lengths of starts and at the end of graph. These waves produced persistently in the chart on many divergent levels
03.what are your thought on this theory ? Why ?
Elliot Wave Theory works brilliantly if you are succeeded in gripping wave 3 then you will definitely make a solid profit . Elliot Wave Theory is one of the elementary unit of technical analysis . Furthermore Elliot Wave patterns are not accurate they are slightly different each time they look . They can have different largeness and different time span . Moreover, these patterns do not veil each time point in the series . Elliot Wave Patterns might provide useful information for stock value prediction . This theory states that market moves are not random but follow by reoccurring cycles determined by mass psychology .
B: Choose a coinchart in which you were able to spot all impulse and correct waves and explain in detail what you see. Screenshots are required and make sure you name which cryptocurrency you're analyzing.
I have taken the Bitcoin market of last week to explain the impulsive and corrective waves.
Following is the picture of the market.
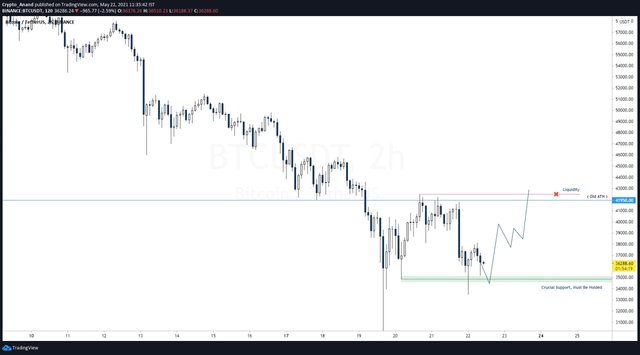
in the above picture, the market is starting in a corrective waves because it is going to downword trend then it is expected that after touching the below line it would again go up. At the end of the picture, the impulsive waves are also shown to explain the bullish trend.
Conclusion
This theory is very valuable and practical to work for cryptocurrency trading. with the help of this theory, one can also judge the market trend of the currency whether it is bearish or bullish and can make a safe investment to earn more profit.
at the end, I am very grateful to dear sir @fendit who has told us about this outstanding theory.
Thank you for being part of my lecture and completing the task!
My comments:
Explanations were fine, but what was most important about this task was to identify the pattern in the chart... and you didn't do it. There was no analysis there... so your work's pretty incomplete.
Overall score:
3/10
Thanks for your review