Head and Shoulders and Inverted Head and Shoulders Pattern- Steemit Crypto Academy- S5W2- Homework post for @utsavsaxena


Introduction

Hello Steemians,
It is another week in the crypro academy. This is the week 2 corresponding to season 5. I am Kehinde Micheal and my username is @msquaretwins here on this great platform. I hope you have been enjoying different lectures from different amazing steemit cryptoacademy professor. I have gone through the lecture presented by professor @utsavsaxena11 on "Trading Strategy for Head and Shoulders and Inverted Head and Shoulders Pattern" in the intermediate class level. Therefore, in this post, I will be answering the questions posted in the homework section. Happy reading!

1. Explain Head and Shoulder and Inverse Head and Shoulders patterns in details with the help of real examples. What is the importance of volume in these patterns(Screenshot needed and try to explain in details)

In finance trading, traders often look for patterns on chart to take market decision. While patterns are very important in trading, sound and good traders often used them as a confluence to their strategy to reinforce the percentage or chance of winning.
There are so many patterns traders use to analyse financial market but all these patterns are broadly grouped into two groups, which are continuation patterns and reversal patterns. Continuation patterns are patterns that shows continuity of the current trend of an asset. When these patterns are spotted on chart, traders often continue to ride on the trend or position themselves to join the current trend. On the other hand, the reversal patterns are patterns that show the exhaustion of a trend, i.e they indicate the end and the exact area where price is likely to reverse to the opposite direction.
Most notable type of reversal patterns are head and shoulder pattern, and inverse head and shoulder pattern because of the unique name and components attributed to them. Let's first talk about head and shoulder pattern.
Head and Shoulder Pattern
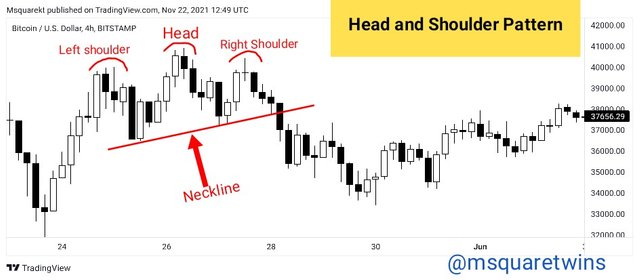
Head and Shoulder pattern are chart pattern that shows the end point of a trending asset in an upward direction. In other words, this pattern is always formed when a bullish trend is about to finish and that the bearish trend is about to begin. That is the reason why it is regarded as bullish-bearish trend reversal. This pattern has three distinct component, the left shoulder, the head and the right shoulder.
 source
The left shoulder of head and shoulder pattern forms when there is sharp rise in price in an upward direction and immediately follow by a quick decline. This will establish the first peak. The next peak that is expected to form after the left shoulder is the head. The head is formed by the high the low of left shoulder makes, and it is must be higher than the left shoulder, if it is not so, then it not the head. The head is the second and highest peak in head and shoulder pattern. The last peak is the right shoulder. This is formed after the head, and the high created in this case must be lower than the end. The right and left shoulders are often formed on the same level. Although they don't always have the same percentage of high but the difference is often minimal.
Inverse Head and Shoulder Pattern
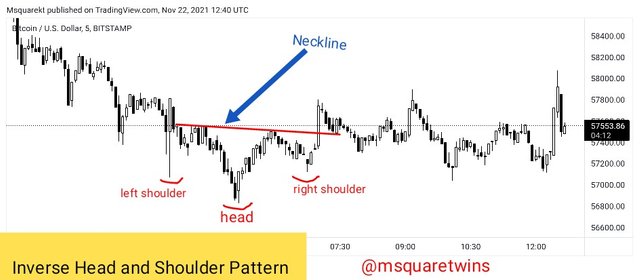
Similar to head and shoulder pattern, inverse head and shoulder is also a reversal pattern. The discrepancy between them is that while head and shoulder forms to show the exhaustion of a bullish trend, inverse head and shoulder indicates the exhaustion of sellers in market which shows that the bearish trend is about to end and the buyers are about to take over. Inverse head and shoulder pattern formation on chart signifies bearish-bullish trend reversal
Also like head and shoulder, inverse head and shoulder pattern have 3 parameters, the inverse left shoulder, the inverse head and the inverse right shoulder
The inverse left shoulder is formed when the price of an asset moves downward, then follow by a sharp move upward. The low made during the downward movement is the left shoulder and the sharp move upward is the point one of the neckline. The second parameter is the inverse head, and this is formed immediately after the formation of inverse left shoulder. It should be noted that the inverse head must be lower than both shoulders. And lastly, the inverse right shoulder is formed after head. This has a low that is higher than that of head and almost the same level with the inverse left shoulder.
 source
Importance of volume in Head and Shoulder and Inverse Head and Shoulder patterns
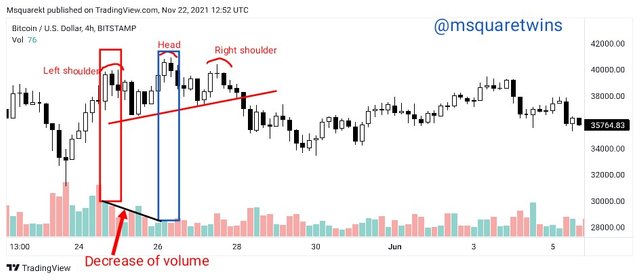
The importance of volume in head and shoulder and inverse head and shoulder pattern can never be overemphasized as it tends to show the path of the price of an assets. For instance, when the left shoulder of head and shoulder pattern is forming, great volume is often seen which shows that the buyers are still in control. But the volume often reduces during head formation which shows that the buyers have started withdrawing their asset from the market.
The same is seen in the inverse head and shoulder where great volume is experience during the formation of the first shoulder but reduces during the formation of inverse head. Therefore, a trader who get the understanding of volume in line with the formation of this pattern often make good market decision.
 source
From the above picture, we can see that BTCUSD has great volume during the formation of left shoulder which shows that buyers are still in charge but when the head was forming, the volume greatly reduced which indicate that buyers have started leaving the market. Having the knowledge of this will put traders on a greater side to know if the head and shoulder they spotted is correct. And we can see that after the formation of right shoulder, sellers take place and drove the price to the opposite direction with great volume.

2. What is the psychology of market in Head and Shoulder pattern and in Inverse Head and Shoulder pattern (Screenshot needed)

Psychology of market in Head and Shoulder pattern
As I have mentioned earlier the head and shoulder pattern is often regarded as bullish-bearish reversal trend because this pattern usually form when a bullish trend is about to end and that bearish trend wants to begin.
 source
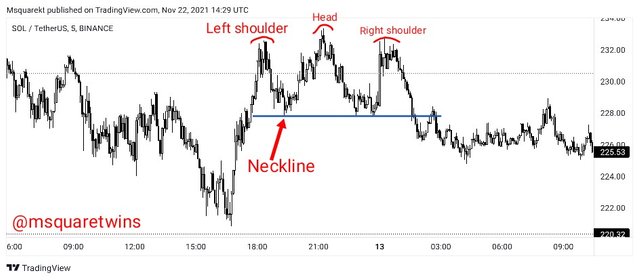
For instance, the chart above is the chart of SOL/USDT in a 5 min TF (Timeframe). Before the formation of head and shoulder pattern in the screenshot above, we can see that the price is moving in an upward direction, but at some point, the price begin to slow down.
The seller came in at the left shoulder and drove the market downward greatly, this create the first level of the neckline drawn. After this, buyers also drove the price upward beyond the the previous high creating the head. Then, sellers also came back and hijacked the market from that point from the buyers and dragged the price downward to create another neckline. Then another buying took place which created the right shoulder but this did not go beyond the head, i.e the previous high.
Lastly, the sellers powers outstrip that of the buyers at that period as the forces of supply is greatly superseded the force of demand and this cause the price to quickly went downward and the neckline was broken. After the break of neckline, the market then moved in a bearish direction.
Psychology of market in Inverse Head and Shoulder pattern
 source
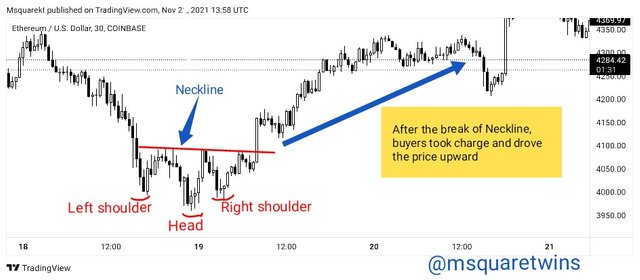
The psychology of market for inverse head and shoulder pattern is the opposite of that seen in the head and shoulder pattern. For example, the picture uploaded above is the chart of ETH/USD on a 30mins Time frame.
Before the formation of inverse head and shoulder pattern, the direction of this asset was bearish. But at some point, the forces of supply begin to weaken and the buyers suddenly entered the market and drove the price upward. After this, the seller came back and took charge again and the price went downward to break the left shoulder created and formed the inverse head. After this, buyers also took charge and also dragged the price upward. This then follow by a slow movement to the downward side which create the second shoulder called right shoulder, but the low created in this aspect did not break the head, this then further signifies the exhaustion of sellers in the market.
After the formation of the right shoulder, the buyers came back to hijack the market from the sellers and they moved market upward greatly even after the break of the neckline.

3. Explain 1 demo trade for Head and Shoulder and 1 demo trade for Inverse Head and shoulder pattern. Explain proper trading strategy in both patterns seperately. Explain how you identified different levels in the trades in each pattern(Screenshot needed and you can use previous price charts in this question)

Explanation of Demo Simulation Trade for Head and Shoulder Pattern
The first thing to do is to find the head and shoulder pattern on chart.
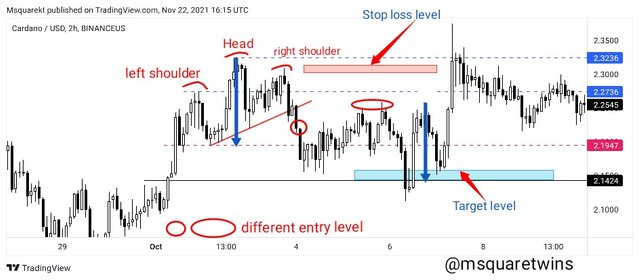
•The chart below is the chart of ADA/USDT on a 2hr time frame.
• As seen in the screenshot below, the left shoulder is spotted followed by the head and then the right shoulder.
• After this, a neckline was drawn by joining the low of the neckline and the low of the head as seen in the picture below
• After this, we wait for the price of ADA/USDT to break the neckline.
 source
Immediately the neckline was broken, a sell entry was taken. This sell entry was taken after price broke the neckline. The stop loss order was placed above the right shoulder as seen in the screenshot above. For target, The difference between the peak of the head and low of the left shoulder was measured. The difference was the further subtracted from the neckline after the break to get the target. This is demonstrated in the screenshot above by the blue arrows.
Explanation of Demo Simulation Trade for Inverse Head and Shoulder Pattern
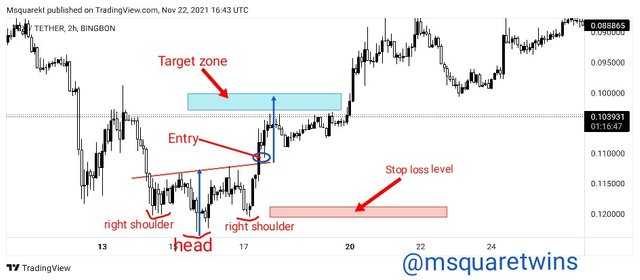
• The first thing to take note is to identify the three parameters of this pattern. The chart below is a chart of TRX/USDT on a 2hr time frame. The assets is on a brarish trend but at some point, the forces of supply is seen to be weaken compared to the forces of demand. Then a shoulder was created as seen in the picture below.
• After the that, the head formed follow by a sharp moved down and then buyers took charge again to create the neckline. Later on, sellers also came back to drag the price downward and the right shoulder was created. But this low didn't go below the head. Then, the pattern was complete.
• Lastly, the buyers came with full aggression and they dragged the price of this asset upward and the neckline was broken.
 source
• After he break of the neckline, the entry was made just immediately after the close of the candle that broke the neckline.
• The stop loss order was placed immediately below the right shoulder as indicated in the screenshot above by a faint red box.
• for the target, the difference between the low of the head and the high of the shoulder was measured. This difference measured is then taken and added to the neckline to determine the target. This is better illustrated in the screenshot above by the blue arrows in the screenshot above.

4. Place 1 real trade for Head and Shoulder(atleast $10) OR 1 trade for Inverse Head and Shoulder pattern(atleast $10) in your verified exchange account. Explain proper trading strategy and provide screenshots of price chart at the entry and at the end of trade also provide screenshot of trade details.(Screenshot needed.)

For this question, I will be take a real trade entry for inverse head and shoulder pattern.
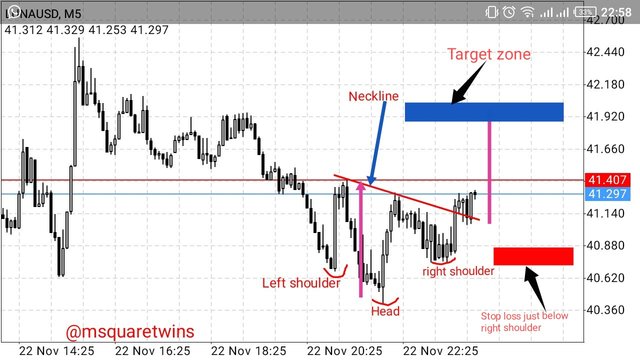
• The chart uploaded below is the chart of LUNA/USD on a 5 minute time frame.
• As seen below, the inverse head and shoulder was spotted. I marked the left shoulder, the head and the right shoulder. Then I drew a neckline as seen in the picture below.
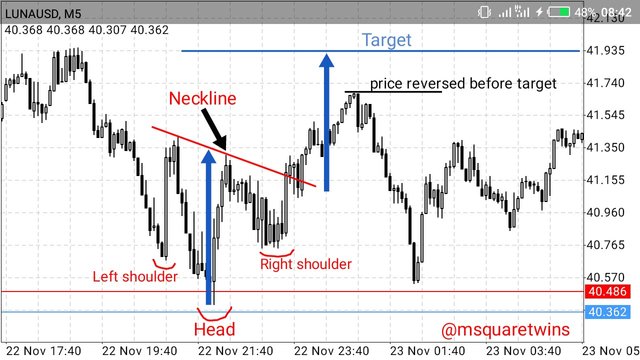
• After this, I waited for the for the break of the neckline. At the break of the neckline an entry order was place with an entry price of $41.29 and the stop loss order was placed slightly below the right shoulder with a price of $40.68 and the target of $41.90. This target was the result of the difference between the head and the lower neckline measured which was added to the neckline as demonstrated in the screenshot by a magenta lines.
• Then I logged in to my veified binance account to place the order.
• I placed a buy order of LUNA/USDT as seen in the screenshot below. The order was taken at current market price which at that time was $41.36
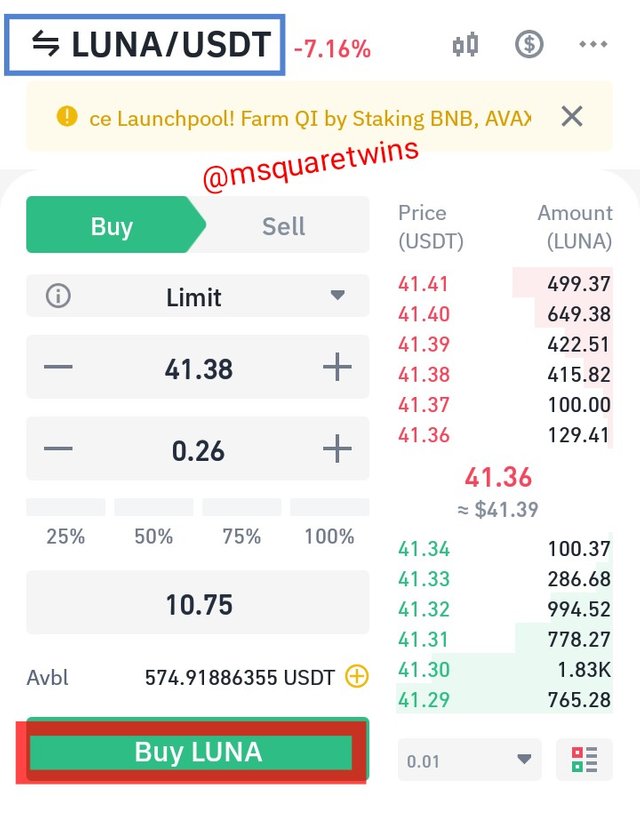
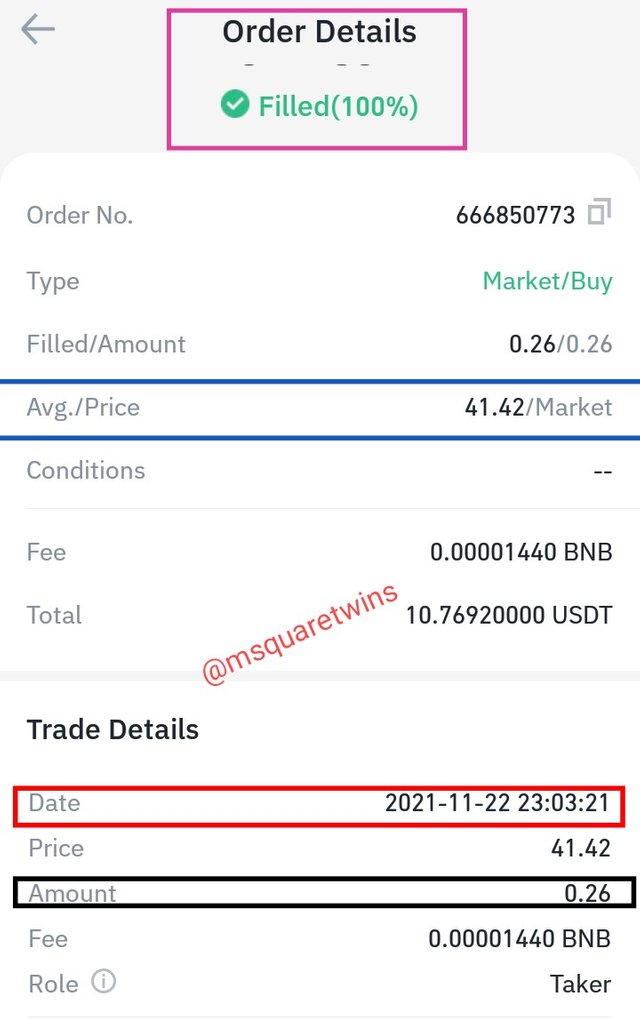
• And below is the screenshot of the of the order details taken from Binance order history. As seen in the screenshot below, 0.26 of LUNA was filled at a price of $41.42. This order was filled on 2021-11-23 at 23:03:21 West African Time as indicated in the screenshot by a red box.
Then then I check the LUNAUSD later to see what price does. I found out that the target was almost reach. The price reversed back at $41.7 to the opposite direction. The target was placed at a price of $41.9, this means that we are few pips away from the target before the price turned to the opposite direction. For more clarification, kindly check the picture below.

Conclusion

Head and shoulder pattern and inverse head and shoulder pattern are not only important in trading crypto they have been said to be been trusted when appeared in market. The unique thing about them is that they can be spotted on any time frame, lower and higher tome frame. The only challenge with them is that they are very hard to find as they require time before complete formation.
Both head and shoulder pattern and inverse head and shoulder pattern have have three unique parameters. But while head and shoulder signifies or indicate bullish-bearish reversal pattern, inverse head and shoulder is often regarded as the bearish-bullish reversal pattern.
Thanks to Professor @utsavsaxena11 for this wonderful lecture. It added a whole lot to me.
Thank you for reading
Written by: @msquaretwins
Cc: @utsavsaxena11