[Crypto Trading with Price Action] || Crypto Academy S6W2 || Homework Post For Professor @reminiscence01|| BY @msalmanjaved
Hello Everyone!
Greetings to All
I Hope everyone is doing well!
Today i am going to complete the Home Work Task of Season 6 Week 2, and task is Related to "Crypto Trading with Price Action" given by the Professor @reminiscence01.


Question# 1
Explain your understanding of price action?

There are several ways of representing the price of an asset on a chart. One such way is the price action. Price action is the visual representation of the price of an asset using different variables. Different technical instruments show this parameter in different ways for example some use only the closing price of an asset to plot a straight line and others line candlestick patterns provide more detail.
A continuous series of price action generated by the movement of price based on the supply and demand forms a graph that can be used to understand the market structure and trend. It forms the basis of all the technical analysis. It generally refers to the up and down movement of the asset many traders exclusively rely on price action for trading especially the short-term traders.
It simply plots prices against time and construct a price structure out of it for example in case of a candle it is based on the closing price, opening price, high price and low price of the asset. Thus, the price action is calculated keeping in view the historical price movements.
Question# 2
What is the importance of price action? Will, you chose any other form of technical analysis apart from price action? Give reasons for your answer?
price action as explained earlier forms the basis of technical analysis for various traders. The importance of price action lies in the fact that it is the base of many indicators such as the Moving Averages. These moving averages uses the price action and plot a line joining the average prices of an asset in the selected time frame.
In addition to that a price action consists of highs, lows and with the help of these it can predict the direction of the market and helps the traders in identifying the right trend. it is impossible to draw the trend without the price action. It shows clear direction of the market and where the market is heading. You can switch between time frames to confirm the overall trend.
Another benefit of price action is that it helps in identifying support and resistance levels. These support and resistance levels represent the buying and selling pressure and the supply and demand.
The price action shows various patterns such as the triangle pattern, double bottom, double top these identify trend continuation or reversal and help in placing buy and sell signals.
It is important to use indicators along with price action for more accurate results.
Indicating the current price, it helps the traders take more calculated decisions it also helps in designing an accurate fundamental analysis. Therefore, a must combine fundamental analysis along with the technical analysis while trading. And therefore, one must pay attention to external factors such as the volume, market cap, an assets overall performance and projects associated with it for better analysis.
Question# 3
Explain the Japanese candlestick chart and its importance in technical analysis. Would you prefer any other technical chart apart from the candlestick chart?
Japanese candle stick patterns are one of the most common ways of showing the price action. It is most widely used because it gives an ideal depth of weight to current price. This candlestick pattern is constructed by connecting a series of candles. This candle stick pattern also forms highs and lows.
Each candle tells a story of the price of an asset and is calculated compared to the historical data such as the closing price, opening price, high price, and low price. These candles also have distinct colors based on the trend. usually, a green candle shows a bullish market and a red candle shows bearish market.
Traders can change these colors based on the preference. Trader can also analyze these candlesticks using different time frames. These candlesticks consist of a body and wick. These candles can be of different types and they can predict various signals. the price action shows various combinations such as the flag pattern, engulfment candles, inverted hammer candles etc.
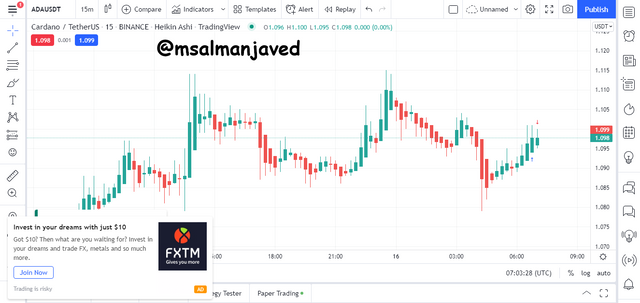
The Heikin Ashi candle stick pattern is used in which each candle begins from the middle of the previous candle. It is known as the average bar. It is easier to analyze and to avoid false patterns and makes Japanese candle stick pattern more readable. The hollow or green candles show strong bullish trend and thus they can be used to confirm the signals. The ADA/USDT chart shows this pattern.
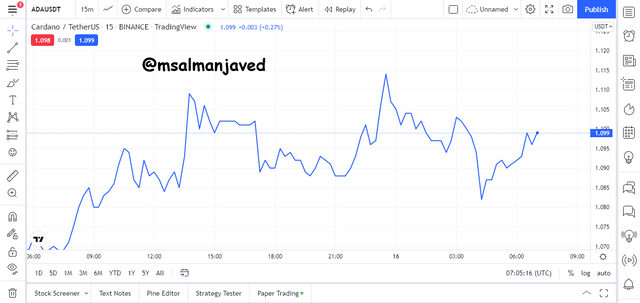
Traders can also line charts that is based on the average price to avoid random fluctuations and when trading long term. They help to have a quick look on the direction of the market despite of going into depth. The ADA /USDT chart shows this pattern below
Question# 4
What do you understand by multi-timeframe analysis? State the importance of multi-timeframe analysis?
In a chart a trader can use different time frames to analyze the asset. Scalpers use time frames like 30m, 15m, 5m and 1m while long term traders may analyze their assets in 4hour, 1 day, or even weekly and monthly charts. Each time frame represents the time period with in which a new candle will form.
In this process you view the same asset in different time frames for more accurate and precise entry. This can greatly increase the margins of profits for traders and thus it is a very lucrative strategy. In extreme volatility the multiple time frame confirms the trend and trade signals.
The importance of this technique is
☑ While using the multiple time frame trader’s can confirm the trend, place accurate resistance and support levels.
☑ These support and resistance levels are very crucial while trading with the price action or in the combination of different indicators.
☑ It also helps in placing accurate buying and selling signals.
☑ Traders use longer time frames to study the trend and place support and resistance levels and then shortens time frame to take entries.
☑ The longer time frames clear the noise and the trend becomes clear you can clean trend lines and identify entry points and supply and demand zones and then go to shorter time frame and place trade signals with tight stop loss.
☑ Thus, you can catch more intricate price movements for your own benefit.
Question# 5
With the aid of a crypto chart, explain how we can get a better entry position and tight stop loss using multi-timeframe analysis. You can use any timeframe of your choice?
In this part of the post, I will use three different time frames to confirm that smaller time frame can help us take a more accurate entry and tight stop loss.
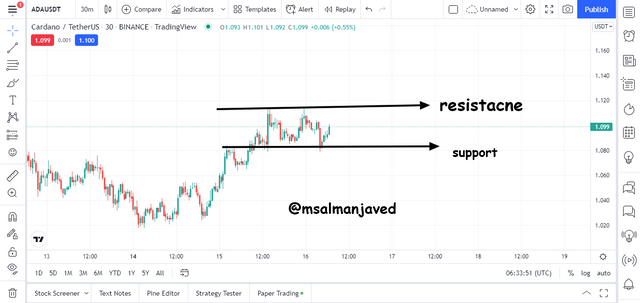
Below is a 30m chart of ADA/USDT we cannot clearly appreciate any trend and taking any entry in this scenario will be to risk however we place the resistance and support levels accordingly.

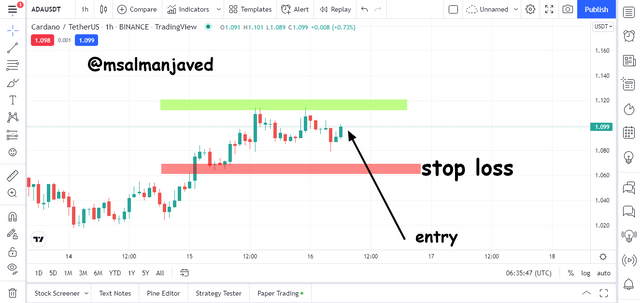
If we see the trend a better glance at a longer time frame such as the 1 hour, we will be able to understand trend better. The 1 hour time frame shows that the price has broken the dynamic support and is currently in retesting to go down. If we place buy order than the stop loss will be around 1.060$.

Lastly in the 15m chart we see that the price is approaching the resistance level we can place a stop loss around 1.080$.
Question# 6
Carry out a multi-timeframe analysis on any crypto pair identifying support and resistance levels. Execute a buy or sell order using any demo account. (Explain your entry and exit strategies. Also, show proof of transaction)?
First of all we analyzed the trend using the 30 min chart it was a bit unclear and to make it clear and reduce the noise we shifted to the 1 hour chart.
The 30 min chart showed the following situation with support and resistance placed.
The 1-hour chart showed that the trend direction was bullish and we analyze by placing stop loss and take profit. Then I shifted to a shorter tie frame for a closer stop loss.
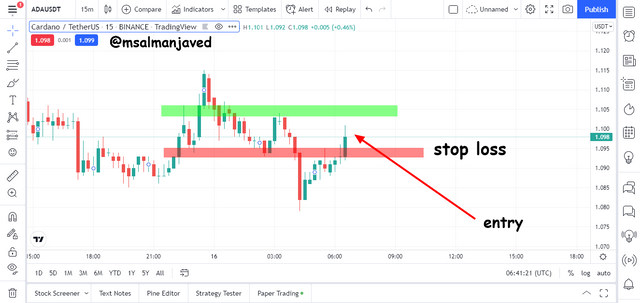
Continuing the above analysis like we already setup the resistance and support levels we can place a demo trade using the 15 min chart.
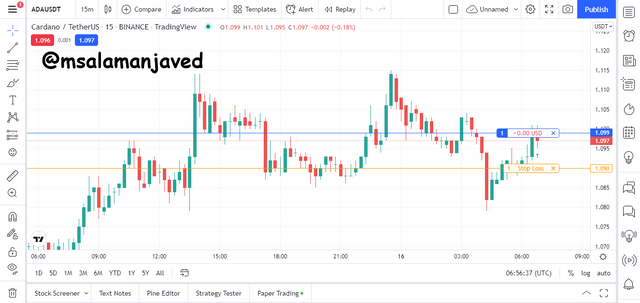
The stop loss was placed just below the last low and buy entry was taken.
Conclusion
The multiple time frame strategy can be very tricky especially for the beginners therefore it is important to first equip yourself with all the basic knowledge of the price action, indicators and then have an understanding how market behaves in different time frame and then use this strategy.
I hope I would get some good remarks from professor on my effort.
Note : All screenshots are taken from tradingview.com all the Images that i have used have been citied and source have given with every image.
Cc :
Professor:
@reminiscence01
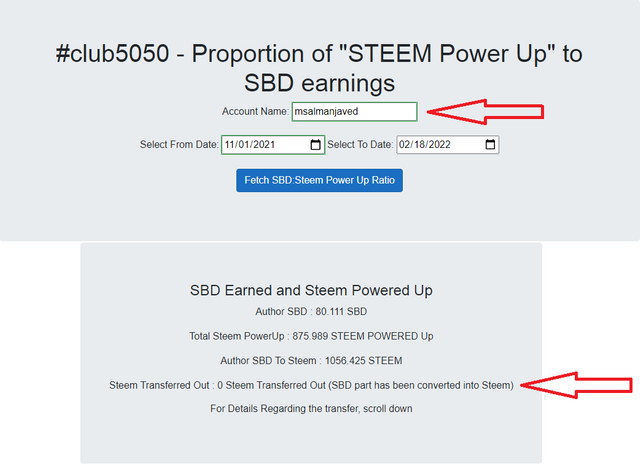
#club5050 Eligible
Hello @msalmanjaved , I’m glad you participated in the 2nd week Season 6 at the Steemit Crypto Academy. Your grades in this task are as follows:
Recommendation / Feedback:
Thank you for participating in this homework task.