[Crypto Trading with Moving Average] || Crypto Academy S6W2 || Homework Post For Professor @shemul21|| BY @msalmanjaved
Hello Everyone!
Greetings to All
I Hope everyone is doing well!
Today i am going to complete the Home Work Task of Season 6 Week 2, and task is Related to "Crypto Trading with Moving Average" given by the Professor @shemul21.

Question# 1
Explain Your Understanding of Moving Average?

It is near to impossible to find a trader who do not use technical indicators. These indicators help us to understand the price movements better and design our analysis with more confidence and surety. One such indicator is the Moving Averages.
Moving averages are a very simple indicator that plots a dynamically moving line calculated from the average price of an asset in a time frame. For example, if you select a moving average of 10 period it will plot a line by adding the recent 10 closing prices and then divide the sum by ten.
In this way they help to smoothen the trade signals and reduce random noise in the price action. They can also serve the purpose of dynamic support and resistance levels and also help to find trade signals. They indicate the direction of the market and hence the trend. on the chart they can move above or below the price action giving important information about the trend.
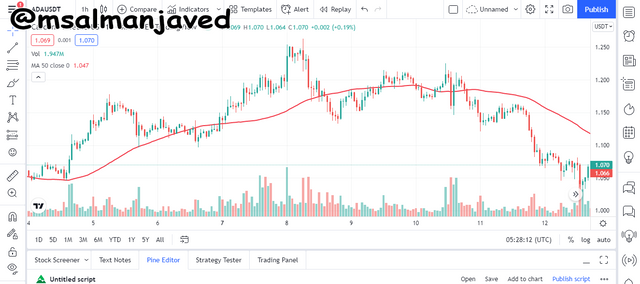
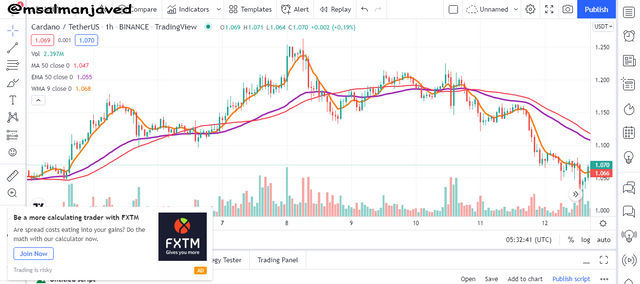
In the ADA/USDT chart below I have shown a Simple Moving Average of 50 periods.
Question# 2
What Are The Different Types of Moving Average? Differentiate Between Them?
Three moving averages are in common use these include the Simple Moving Average, Exponential Moving Average and Moving Average Weighted. The different types have their own significance and are calculated using different variables.
1. Simple Moving Average
Simple Moving Average simply plots the average price of an asset in the selected time frame. This is plotted in the form of dynamic line whose position changes with the changing closing prices of the asset. Thus, all the prices of the asset are dealt equally. It gives the true average price. SMA in 50 periods.

Differences with the others
☑ it gives equal importance to all prices of the asset.
☑ it is calculated by adding the recent closing prices and then dividing by the selected number of periods.
☑ more useful for longer time frames.
2. Exponential Moving Average
Exponential moving average gives more weight to the recent price action changes. It involves more complicated applications and thus gives more detail about the changes in the price. It is more sensitive to changes and provide more accurate price indications about reversals.
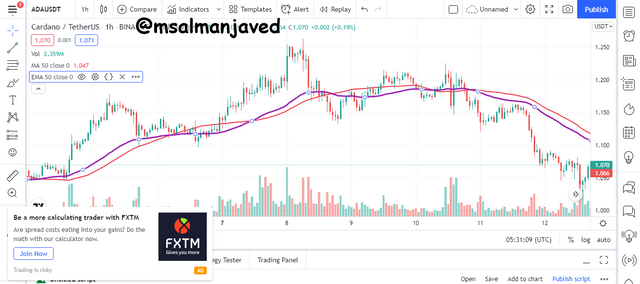
EMA in 50 periods (purple line).
Differences from other Moving Averages
☑ more sensitive then SMA.
☑ ideal for short terms traders.
☑ provide more accurate trade setup.
3. Weighted Moving Average
Weighted Moving Average is even more centered around the recent price changes. it gives little importance to historical date. To get the most recent data the price of each candle is further multiplied by a weighting factor. The sum of all weights account for 100%. WMA highlighted in orange.
Differences from others
☑ it is more descriptive than SMA.
☑ more focused on recent price data.
☑ includes the weighting factor.
☑ ideal for both long term and short traders.
Question# 3
Identify Entry and Exit Points Using Moving Average. (Demonstrate with Screenshots)?
In this part of the post, I will be using a 20 period EMA on the ADA/USDT chart to illustrate the accurate entry and exist signals.
Bullish Entry and Exit signal
Following conditions should meet to place a buying signal using.
☑ Price action must be trading below the EMA indicating a bearish trend.
☑ The Price action must cross the EMA breaking the resistance.
☑ It should remain below it or retest back and touch the resistance line.
☑ An immediate buying entry should be taken once the price retests.
☑ Stop loss should be placed in the ratio 1:2 or just below the resistance.
This is illustrated in the ADA/USDT chart below

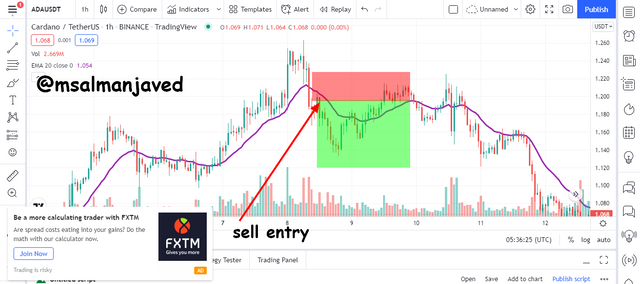
Bearish Entry and Exit Signal
Following conditions should meet to place a buying signal using.
☑ Price action must be trading above the EMA indicating a bullish trend.
☑ The Price action must cross the EMA breaking the support.
☑ It should remain above it or retest back and touch the support line.
☑ An immediate sell entry should be taken once the price retests.
☑ Stop loss should be placed in the ratio 1:2 or just above the support.
This is illustrated in the ADA/USDT chart below.
Question# 4
What do you understand by Crossover? Explain in Your Own Words. ?
Crossovers are manifested when more than 1 Moving Averages are used. A shorter moving average is considered because it plots and covers the data for lesser number of period and a longer MA is considered slow because it plots the data after a larger number of periods.
A crossover occurs when either the shorter moving average exceeds the longer moving average or becomes less than it.
Crossovers help in the prediction of trend reversals and thus take more accurate buying and selling entries. They are widely used by traders.
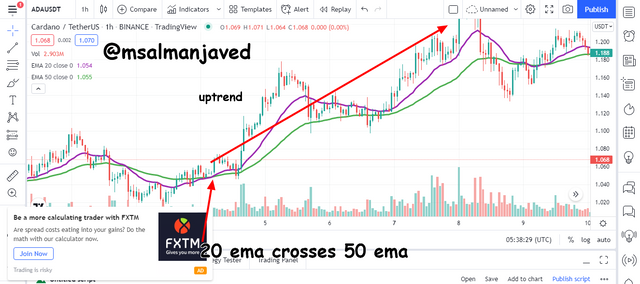
For example, when the shorter moving average crosses above the longer moving averages it indicates the upcoming onset of the bullish trend and thus you should buy and hold the asset. The ADA/USDT chart explains the above concepts by using a 20 and 50 EMA.
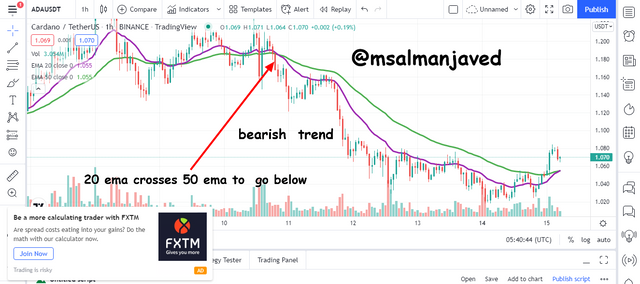
On the contrary when the shorter MA crosses the longer MA and goes below it predicts a downtrend and hence you should sell or short the market. The ADA/USDT chart explains the above concepts by using a 20 and 50 EMA.
Question# 5
Explain The Limitations of Moving Average.?
There are certainly many uses of the Moving Averages and therefore they are so widely used are in fact a part of every strategy but there are certain shortcomings that need to be kept in mind while using them.
❌ It is often noticed that the crosses are formed far after the trend reversal happened and the traders who rely only on moving averages for the assurance of trend reversal usually miss early opportunities.
❌ This problem presents us with the issue of incorporating a number of indicators with moving averages such as the RSI.
❌ In addition to that it only shows the average price based on the chart data and does not take into account buying and selling pressure or market momentum or any outside variable.
❌ Therefore, it depends a lot on the price and thus in most cases its useless for traders.
❌ You have to be very accurate with the time period you are selecting because all the trading signals depend on the period you chose.
Conclusion
Moving averages are technical indicator tools that many traders use. They plot the average price of the asset in the given time frame. They highlight support and resistance zones, Bullish and bearish reversals, price trends and much more. They can be used in both short- and long-term trading styles and have three types.
I hope I would get some good remarks from professor on my effort.
Note : All screenshots are taken from tradingview.com all the Images that i have used have been citied and source have given with every image.
Cc :
Professor:
@shemul21

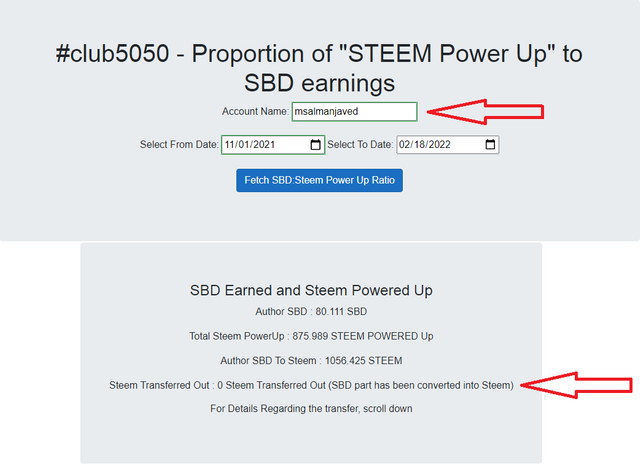
#club5050 Eligible