Trading Steem with Elliott Wave Theory
Good evening friends, today is Sunday 7th Ashwin 1431 A.D., 22nd September 2024 A.D., 17th Rabiul Awal 1446 A.H., how are you all, hope everyone is well and having a very nice day. I want to thank @crypto-academy to organize this course in SEC season 20 which is named "Steemit Crypto Academy Contest / S20W2: Trading Steem with Elliott Wave Theory" and today i am participating on this contest.
Elliott Wave Theory is a type of technical analysis that makes predictions and descriptions of market activity based on the idea that the psychology of investors as a whole drives the financial markets' repeating, fractal patterns of movement. In the 1930s, Ralph Nelson Elliott created it after seeing that price changes in marketplaces often followed distinct patterns, or "waves." Elliott's introduction to the area of market analysis came rather late in his life. Following a successful career as an accountant in South America, he was forced to retire early due to health difficulties. With plenty of free time at his sixty, Elliott directed his analytical mind toward the stock market. An informal curiosity quickly developed into a thorough analysis of historical stock market data, with a special emphasis on the Dow Jones Industrial Average. Using his accounting expertise and keen analytical skills, Elliott noticed something remarkable: stock prices do not move randomly. Instead, they follow specific and repetitive patterns that reflect the psychology of market participants. This observation was the foundation of what he would later call The Wave Principle, or more simply, Elliott Wave Theory.
Question 1: Describe the Five Impulsive Waves of Elliott Wave Theory |
|---|
Impulsive waves are the major moves that move with the main trend, in Elliott Wave Theory. They are five specific waves that progress in the direction of the larger trend and are numbered thus: 1, 2, 3, 4, & 5. These waves create the basis of market movement and are then followed by a corrective wave pattern. The characteristics of the five waves are given below,
Wave 1 (Impulsive): This wave marks the beginning of a fresh trend, which frequently emerges following a notable market bottom. Wave 1 denotes the initial upward movement in a bullish trend. This wave may be subtle since traders may not yet be persuaded that the trend has changed.
Wave 2 (Corrective): If we consider more conventional rules, in particular based on Fibonacci ratios, Wave 2 should retrace a percentage of the previous wave (from 50 to 61.8% of Wave). One key point to note here is that it will not retrace more than 100% of Wave 1, anymore retracement invalidates the Idea of impulsive structure. This is a corrective wave inside of the larger trend, it hunts down weak hands.
Wave 3 (Impulsive): Typically wave 3 is the strongest and extended impulse in an Impulsive Market. In a bullish case of such as STEEM/USDT, this wave indicates respected and strong buying strength followed by high trading volumes. Wave 3 often extends beyond the termination of Wave 1, moving them more convinced that a new trend is under way.
Wave 4 (Corrective): This wave is a correction to the powerful Wave 3, usually retracing less than 38.2% of Wave 3. It is often a shallow pullback, and it must not overlap with the price territory of Wave 1. Like Wave 2, it shakes out some traders but remains in line with the overall trend.
Wave 5 (Impulsive): Wave 5 marks the final move in the direction of the trend, often showing less momentum than Wave 3. This wave can show divergence in indicators (e.g., RSI showing less strength even as price makes a new high), indicating that the trend is losing steam. In this wave, the market reaches its peak before a larger correction or reversal occurs.
Let's take a look at the following candlestick chart of STEEMUSDT in 1-hour trades on the Binance spot market as seen on Tradingview which occurred on this month. The below screenshot shows impulsive waves in a bullish trend.
.jpg)
Elliott Wave Theory classifies market movements into two types and they are impulsive waves and corrective waves. These waves are the core of price action analysis, and understanding their fundamental differences is critical for analyzing market movements.
Key Criteria That Differentiate Impulsive Waves from Corrective Waves:
| Criteria | Impulsive Waves | Corrective Waves |
|---|---|---|
| Direction | Moves in the direction of the overall trend | Moves against the overall trend |
| Wave Structure | 5-wave pattern (Waves 1, 2, 3, 4, 5) | 3-wave pattern (A-B-C) |
| Momentum | Strong momentum, especially in Wave 3 | Weaker momentum, often choppy or sideways |
| Wave Rules | Follows strict rules (no overlap of Wave 1 and Wave 4) | More flexible; overlap often allowed |
| Length & Duration | Typically longer in price movement and time | Generally shorter in price and duration |
| Psychological Impact | Reflects confidence in the trend (optimism in bull market, fear in bear market) | Reflects uncertainty, hesitation, or profit-taking |
| Typical Volume | Higher trading volume | Lower trading volume |
| Wave Characteristics | Waves 1, 3, 5 move with the trend, Waves 2, 4 correct the trend | Can take forms like zigzag, flat, or complex patterns |
Question 2: Identify Impulsive and Corrective Waves on a Steem Chart |
|---|
Finding the impulsive moves, or the primary trend direction that contains the waves, is the first step towards identifying impulsive and corrective waves on a chart. According to Elliott Wave Theory, every impulsive move always consists of 5 waves and in these waves 1, 3, and 5 are impulsive waves on the other hand waves 2 and 4 are corrective waves. Impulsive waves move in the direction of the main trend while corrective waves move in the opposite direction from the main trend direction. Now, Let's look at the STEEMUSDT historical price chart on 1-Day trading between October 12, 2023 and November 10, 2023 on the Binance Spot market as shown in the TradingView below,
.jpg)
In this image, we can see that the Impulsive Move is bullish and waves 1, 3, and 5 move in the direction of the main trend so we can call them impulsive wave on the other hand waves 2 and 4 are the Correction Waves which move in the opposite direction or sideways to the main trend direction.
Question 3: Explain the Alternation Rule in Corrective Waves |
|---|
Alternation Rule: According to the alternation rule in Elliott Wave Theory, if one corrective wave—Wave 2 or Wave 4—is simple, the other corrective wave is probably complicated. It helps traders in predicting the composition and characteristics of next corrective waves. When used correctly the alternation rule can provide valuable information to forecast market behavior and set your trading system up for long-term profitable success. As an example, the second Corrective Wave cannot take the form which has been described for the first Corrective Wave.
How the Alternation Rule Applies to Corrective Waves: In an impulsive 5-wave cycle, Waves 1, 3, and 5 will move in the trend direction whereas Waves two and four are corrective waves moving against this. The alternation rule regulates the connection of these two counter trend waves, establishing to it that they should not develop in the same way.
Wave 2 and Wave 4 Differ in Form: Where Wave 2 will often be a simple correction (for example, zigzag)Wave 4 will often be more complex (for example, flat or triangle). If Wave 2 is a complex correction (like a flat or triangle), wave 4 is likely to be simple and sharp (like a zigzag).
Variation in Depth and Duration: If Wave 2 is deep (retracing a significant portion of Wave 1), Wave 4 tends to be shallow and less aggressive. If Wave 2 is short and sharp, Wave 4 may take longer and exhibit a sideways consolidation.
Types of Corrections: In the following image we can see that there are two types of corrections, they are Simple Correction and Complex Corrections.
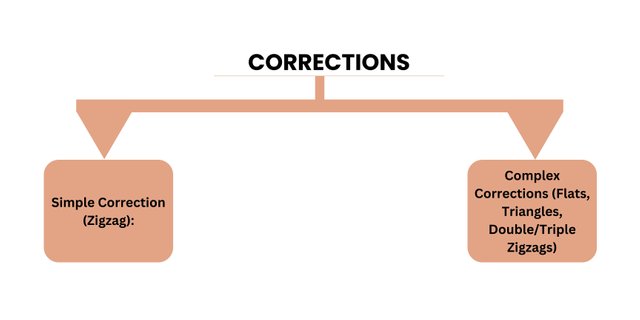
Simple Correction: Typically a sharp, straightforward A-B-C correction where prices move decisively against the prior trend.
Complex Corrections: Involve overlapping wave structures, often leading to sideways movements and extended periods of consolidation.
By recognizing the alternation rule, traders can better predict how corrective waves might unfold and plan their trades accordingly. If a trader notices that Wave 2 was a simple, sharp correction, they might expect Wave 4 to be complex and range-bound. This allows the trader to anticipate more time-consuming consolidations in Wave 4 and avoid entering positions too early during the correction. There are some key ways the Alternation Rule influences trading and they are given below:
Managing Expectations for Wave 4: If a trader sees a simple correction in Wave 2, they should anticipate a longer and more complex Wave 4. This might mean avoiding early entries during the complex correction, as the price may move sideways or fluctuate for an extended period.
Identifying Breakout Points: If Wave 2 was complex, traders might expect a quick and sharp retracement in Wave 4 and position themselves to reenter the market at the end of the correction, preparing for Wave 5.
Timing: Understanding whether the market is in a complex or simple correction helps traders adjust their timing for entries and exits, especially during Wave 4.
Example Of A Complex Correction Versus A Simple Correction Using A Steem Chart: At first I am going to show you the simple correction using a steem chart. Here I am using steem/usdt candlestick chart from tradingview.
.jpg)
Now, I am going to show you the complex correction using a steem chart. Here I am using steem/usdt candlestick chart from tradingview.
.jpg)
Question 4: Plot a Trading Scenario for Steem Based on Elliott Waves |
|---|
I have looked at the TradingView historical price chart for the STEEM (STEEMUSDT pair) based on 4-hour timeframe that occurred on the Binance spot market between Monday, August 5, 2024, and Saterday, August 24, 2024. As seen in the graphic below there was a bullish-type Impulsive Move between Monday, August 5, 2024, and Saterday, August 24, 2024.
.jpg)
Strategy For Entering And Exiting Trades During Each Wave: First of all, Wave 1 is the initial portion of a bull market and it usually happens immediately after a significant trough in the market or right after the reversal influenting from bear to bull. I could conceivably miss the very start of Wave 1 while waiting for the formation of Wave 2, and rather enter late than early. Once I identified Wave 1, I would draw a Fibonacci retracement from the beginning of Wave 1 to its top. Then i will seek prices to begin their retracement before hitting a 38.2%,50% or 61.8% and we can conclude that Wave 2 is completed.
Wave 2 usually retraces a significant portion of Wave 1 but cannot retrace all the way down. So i will take my entry near the 38.2% to 61.8% Fibonacci retracement levels of Wave 1, as these levels often mark the end of Wave 2. Then I will set the stop-loss just below the 61.8% Fibonacci retracement to protect against further downside.
Wave 3 is typically the strongest and longest of the impulsive waves. I will add to my position once Wave 2 completes and the price starts moving upward. If I can see strong momentum or a breakout above the Wave 1 high, it could be a good confirmation to enter. I will set my target 161.8% or 261.8% Fibonacci extension levels for my first take-profit targets, as Wave 3 often extends significantly. I will consider partial exits as Wave 3 approaches these Fibonacci extension levels.
Wave 4 is typically a sideways or consolidating correction after the strong move in Wave 3. I will avoid entering new trades during Wave 4, as it is often choppy and can move sideways. If I am holding a position from earlier, I will tighten stop-loss levels because may be i will take profits near key support or trend lines within Wave 4.
Wave 5 is the final push in the direction of the trend but often lacks the strength of Wave 3. I will enter after confirming the completion of Wave 4 and look for breakouts to trade Wave 5. However, Wave 5 may have diminishing momentum compared to Wave 3. I will look to exit near the 161.8% or 261.8% Fibonacci extensions from the start of Wave 1.
Question 5: Analyze Steem's Current Market Trend Using Elliott Waves |
|---|
Here is the latest historical price chart of STEEMUSDT in 4-hour trades on the Binance spot market as seen on Tradingview , which I observed on Sunday, September 22, 2024.
.jpg)
The image shows that between Saturday, September 7, 2024 and Sunday, September 22, 2024 there was a bullish Impulsive Move in the STEEMUSDT price. In this time period we can see that wave 1,2,3 are already completed. Now, Its forming the wave 4 and then wave 5 will be form. As we know that Wave 4 is typically a sideways or consolidating correction after the strong move in Wave 3 so we should avoid entering new trades during Wave 4 because it is often choppy and can move sideways. If we are trading based on Elliott Wave Theory, patience will be key, and confirming the end of the corrective wave with both price action and indicators will help reduce risk. So for now we should wait for completing this wave 4 and then we should take the entry as i discussed above about how to entry in between wave 4 and wave 5.
The way you presented the analysis shows a deep understanding of the topic and I am sure it will be helpful for others trying to learn the same. Keep up the good
Thank you so much for your kind words!
Hi @mrsokal
Elliott Wave Theory is an important tool to analyse the crypto market of any token. We can analyse the STEEM market as well. There are 5 impulsive waves and after those 3 consecutive corrective waves. From the 5 impulsive waves we see that 1, 3 and 5 are impulsive and 2 and 4 are corrective. So we can manage our trades accordingly. Best wishes for the contest.
My dear friend seeing you after a long time thank you very much for participating in the contest your analyzes were really amazing which taught me a lot.technical analysis technique that analyses the markets trend for pricing movements that comes in a repetitive pattern of waves. Described by Ralph Nelson Elliott as being made of 5 impulsive waves in the direction of a current trend and 3 corrective waves in the opposite direction, to give information regarding current market psychology and possible direction that a particular price range is for.
Thank you so much dear for your valuable comments