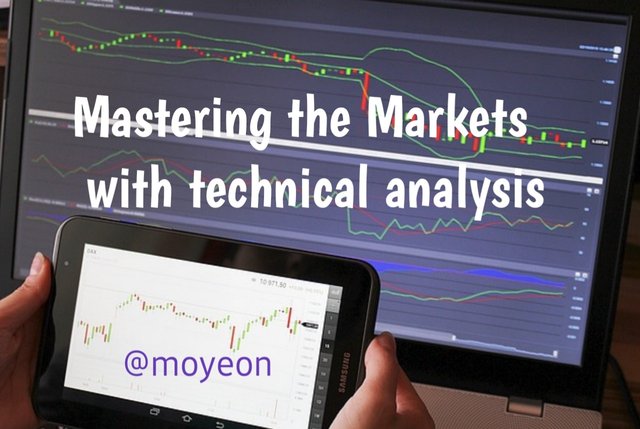
SEC S18-W1 || Mastering the Markets with technical analysis
Hello SteemitCryptoAcademy |
|---|
INTRODUCTION |
|---|
Greetings friend. Trading is the business which requires knowledge to control your assets in volatile market.I am very happy to participate in this contest to deliver my learnings. I hope you to seek something as I drop down my knowledge and give hints on crucial topics. Let's start.
What is the importance of technical knowledge in trading? Describe the key components and information you can gather from a technical chart. |
|---|
We all are familiar with the importance of technical knowledge. It plays an important role in selling and buying shares or currency or stocks and assets.
I have listed below, how technical knowledge benefits us-
●TREND IS YOUR BEST FRIEND IN TRADING
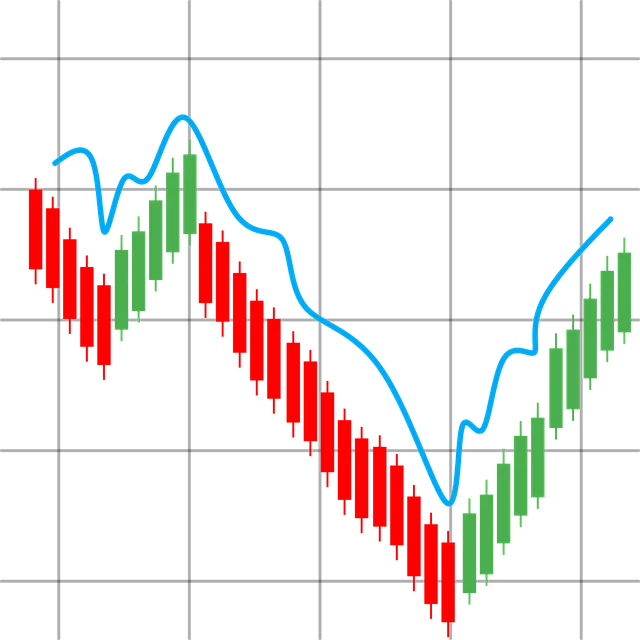
Trading with the trend is one of the principles of Warren Buffet and it is really the right and profitable way to trade. There are many trend identifying indicators that tell us about the trend like moving average. It identifies whether the trend is uptrend and downtrend and accordingly we can make buying and selling decision.
● IMPORTANCE OF MARKET TIMING
Market timing is an important factor while trading. If the rest of the people are steady in the trade, we can make profit by entering and exiting before others. We should take interest of the early signals given by the technical analysis and indicators and act accordingly.
●USE FUNDAMENTAL ANALYSIS FOR STOCK SELECTION
Fundamental analysis is like a background check of the security for short-term trading. Investors usually use fundamental analysis for long-term investing and not for trading. We can see how the market has performed in the past few years and then we can select the stock for investing or trading. But we cannot generate buy and sell shares or signals through fundamental analysis. Buying and selling share can only be generated through the best technical indicators for short-term trading.
● MANAGING TRADES
Market movements are unpredictable. We should always give a stop loss to our trade while buying or selling shares or assets. Sometimes technical indicators give us wrong signals. Stock market has both ups and downs.
We should manage our risk. If we check our losses, we can find a way to avoid loss in future. We should also check our profits. We can find a method to increase our profits.
●NEVER REVERSE YOUR TRADING PLAN
As we have discussed that technical indicators do not always give correct analysis. When we enter the trade there is no chance to reverse and control the trade. But we can control our emotions. When we put a stop loss on our trade we are reducing our losses. We should not get emotionally attached to our trading and accept the loss. We should establish our trading rules to overcome our losses.

Explain how to read candlestick charts and the significance of different time frames in trading. |
|---|
Candlesticks In trading is of huge importance. You must be wondering that is it is similar to the candles we use in the daily life or different ?? Candlestick is referred by the length of the candles to prices of any shares or currency or stocks or assets. The length of candlesticks shows typical trends via its length and its movements.
The length of the candlesticks shows the price range . It has two wicks. The upper wick shows maximum price and lower Wick shows minimum price. If the candle is in red colour it means the closing price is less than the opening price. That is traders suffered losses. If it is in green colour it means the closing prices is more than the opening price which indicates profit margins for traders.
Here, I have described some types of candlestick patterns below -
| Marubozu Candlestick Pattern |
|---|
Marubozu candlestick pattern are Japanese momentum candles (indicating strong momentum), which often appear at support and resistance levels. Marubozu candlestick pattern has either two wicks or none, and this indicates strong sell-off resistance or strong buy-off support.
(Marubozu Bullish Candlestick Patterns)
✔ A blue Marubozu candle appearing in an uptrend indicates a possible continuation of the trend.
✔️ A blue Marubozu candle appearing in a downtrend may signal the end or reversal of the current trend.
(Marubozu Bearish Candlestick Patterns)
✔️ A red Marubozu candle appears in a downtrend and confirms the possible continuation of a forex downtrend.
✔️ A red Marubozu candle appears in an uptrend and signals a possible trend reversal.
| ▪︎ Hammer Candlestick Pattern |
|---|
The hammer candle has a long lower shadow, usually at least twice the length of the body, and a small body. It is a bullish reversal candlestick pattern, appearing at the bottom of a downtrend.
The hammer candlestick pattern tells us that, despite strong selling pressure during the session, eventually, buyers took control and forced the price upwards.
The hammer candle body can be either bullish or bearish, but if it is bullish it is considered a strong signal.
| Shooting Star Candlestick |
|---|
The shooting star candle appears in an uptrend, indicating a potential reversal. It looks wispy and is essentially the opposite of the hammer candlestick, which has a long upper shadow and a short body.
The shooting star candle body can be either bullish or bearish, but if bearish, it is considered strong.
| ▪︎Hanging Man candlestick |
|---|
The hanging man candlestick looks similar to the hammer, the difference being that it occurs at the top of an uptrend, and signals a potential bearish reversal.
However, during an uptrend, this forex candlestick pattern is often seen as a sign that buyers are starting to lose control of the market and therefore, a reversal is about to occur.
| ▪︎ Piercing Line Candlestick |
|---|
Typically, the bullish candle will also open lower than the close of the bearish candle; however, in the market, the pattern is still valid – although not considered strong – if the open of the second candle is equal to the close of the first candle.
| ▪︎Dark Cloud Cover Candlestick |
|---|
As with the Piercing Line, in the Forex market, the Dark Cloud Cover candlestick is also considered valid if the second candlestick opens at a close below the close of the first candlestick.
However, the important thing is that the second candle in this Forex candlestick pattern must close somewhere below the 50% mark of the body of the first candle.
| ▪︎Engulfing (Bullish) Candlestick Patterns |
|---|
The bullish engulfing candle is characterized by two candles, the first of which is bearish, and contained within the body of the second candle – which is always bullish.
(Engulfing Bearish Candlestick Patterns)
The bearish engulfing candle is also characterized by two candles. The first is bullish, and contained within the body of the second candle, which is always bearish.
The time frames are of three types-
-Long term
-Medium term
-Short term
As the name suggest, the long term time frames will give you the weekly or monthly analysis of market prices. Medium term time frame will give an analysis of about 4 to 12 hours of market prices and the short term time frame will provide max to max, 1 hour analysis of market prices. It helps the traders to know the exact market Trend.
Define chart patterns and differentiate between continuation patterns and reversal patterns. How can chart patterns be utilized to set effective stop-loss orders? |
|---|
Chart patterns are used for technical analysis in the stock market, which are not 100% accurate, but reduce the loss, and if you work well in the stock market according to the chart patterns. So at the end of the month you will be able to earn profit. Most chart patterns are currently used by traders.
For chart patterns, those working in the stock market look at the patterns of the last several days and do their trade according to the chart patterns being formed at present. Besides, the market also runs completely according to the chart pattern. Let us tell you that if you work according to the chart pattern, the loss is fixed. But profit is not fixed, that is why experts also say that by working with chart patterns, traders earn lakhs of rupees a day.
No chart pattern works all the time, but they can give a trader a greater understanding of what is happening in the market. It is important to use not only intraday trading chart patterns to make decisions, but also to incorporate other forms of technical analysis and proper risk management tools together.
Chart patterns can be basically classified into:
-Continuation patterns
-Reversal Patterns
-Bilateral Patterns
CONTINUATION PATTERNS
When a pattern is forming on the chart of a stock in the stock market which indicates going in the same direction, it is called Continuity chart pattern. Like if the market is going up, it will continue to go up.
- Bearish Rectangle Patterns
- Bullish Rectangle Patterns
- Bearish Flag Patterns
- Bullish Flag Patterns
- Bearish Pennant Patterns
- Bullish Pennant Patterns
- Bearish Symmetrical Triangle Patterns
- Bullish Symmetrical Triangle Patterns
- Cup and Handle Patterns
- Reverse Cup and Handle Patterns
REVERSAL PATTERNS
When there is a change in the current trend in the stock market . Or I can say that a reversal pattern means a change in trend. Due to which the share price starts moving up or down, that is why it is known as Reversal Chart Patterns.
•Double Bottom Pattern
•Double Top Pattern
•Reverse Head and Shoulders Pattern
•Head and Shoulders Pattern
•Bullish Expanding Triangle
• Bearish Expanding Triangle
• Triple Top Pattern
• Triple Bottom Pattern
• Falling Wedge Patterns
• Rising Wedge Patterns
Here some of the chart patterns we must understand -
| •Head and shoulders |
|---|
It means that in this pattern there is a head which is formed in the middle and there are two shoulders which are formed on either side of the head. The head is bigger than both the shoulders. This pattern looks like our Head and Shoulders. Yes, that is why it is called Head and Shoulders Pattern.
| • Cup and Handle |
|---|
A Cup and handle is a bullish reversal chart pattern that resembles a cup and handle where the cup is in the shape of a "U", and handle has a slight downward drift.
This patterns is a bullish continuation pattern that signals a strengthening of a security's price succeeded by a 9 breakout, followed by a dividend price increase.
| •Wedges |
|---|
Wedges are bullsh and bearish reversal patterns that are formed by joining two trend lines that coverage.
| •Pennants |
|---|
At a certain point in the Bearish Pennant chart pattern, both support and residence start meeting each other at one place. After some time, due to selling pressure in the market, the support is broken and the market starts moving downwards. Yes, that is called Bearish Pennant chart pattern.
At a certain point in the Bullish Pennant chart pattern, both support and residence start meeting each other at one place, after some time due to buying pressure in the market, the residence is broken and the market moves up. When it starts moving, it is called Bullish Pennant chart pattern.
| •Symmetrical Triangles |
|---|
Bearish Symmetrical Triangle Chart Patterns mainly symbolize volatility contraction in the market. In other words, market volatility is gradually decreasing and a breakout or breakdown may occur soon.
This pattern is seen when a stock's price is consolidating in such a way that two closely sloping convergent trend lines are formed.
This chart pattern itself indicates that the share price is about to undergo a breakdown or breakout before an ongoing period of consolidation.
If the lower trend line is broken, it marks the beginning of a new bearish trend.
Bullish Symmetrical Triangle Patterns is a variation of the symmetrical triangle pattern. In this pattern the lower trendline rises, while the upper trendline remains flat. This reflects a bullish bias and suggests buyers becoming more aggressive as the price consolidates. Traders often look for breakouts above the upper trendline for upside prospects.
| •Ascending Triangle |
|---|
It is type of continuation chart patterns. An ascending triangle day trading stock chart pattern shows a period of consolidation after an upward move, and then further up. The ascending triangle pattern is formed through a horizontal resistance line at the market swing highs, and an ascending trend line with the market swing lows acting as a support level.
It takes at least two swing highs to reject the same price level to form a horizontal resistance line and at least two higher swing lows to form a trend line. If the price breaks through the horizontal resistance line, it is a potential signal for the uptrend to continue.
However, the price may break through the bottom of the ascending triangle pattern, which suggests the market’s failure to move higher and the development of a potential downtrend.
| •Descending Triangle |
|---|
It is also type of continuation chart patterns. One of the best chart patterns for intraday trading, a descending triangle pattern marks a period of consolidation by moving up and down, before moving further down.
The descending triangle pattern is formed through a horizontal support line at the market’s swing lows, and a descending trend line is formed with the market’s swing highs acting as a resistance level.
It takes at least two swing lows to reject the same price level to form a horizontal support line, and at least two lower swing highs to form a trend line. If the price breaks through the horizontal support line, it is a potential signal for the downtrend to continue.
As is the case with the formation of an ascending triangle, the price may break out on the other side. If the price breaks through the top of a descending triangle pattern, it suggests the market's failure to continue its downtrend, and a potential signal for the formation of a new uptrend.
Day trading strategies using the ascending and descending triangle chart pattern can be carried out in forex, stocks, indices and commodities and on multiple day trading time frames such as 5-minute, 15-minute, 30-minute and 1-hour charts.
The ascending triangle pattern shows multiple swing high rejections at the upper horizontal resistance line, and at least two swing high lows forming a trend line. Some traders may draw their price levels at the lows and highs of the bar or candle, but also the closing price.
When day trading the ascending triangle pattern traders can either trade as the price is breaking the top horizontal resistance line, or wait for the first bar to close above it. The stop loss can be below this bar, or below the trend line, if it is a false breakout at the top.
Any form of day trading is challenging, and carries a high level of risk, so it is advisable to start on a demo account first to build up the necessary skills.
STOP LOSS ORDERS |
|---|
Stop-loss orders are an important part of the trading and risk management mechanism. You can use them to limit your losses to a particular level when the market is facing a huge loss.
What is a Stop-Loss Order?
An important part of a stop-loss order is the trigger price. A stop-loss order enables traders to limit their losses by placing an order when a particular trigger price is reached. When the price of the security reaches the trigger price, the stop-loss order is automatically executed without the need for any human intervention.
There are two types of stop-loss orders:
•Stop-loss market order: includes only the trigger price.
In this case, once the trigger price is reached, the stop-loss order is converted into a market order and executed as quickly as possible at the best price.
• Stop-loss limit order: Includes trigger price and limit price.
In this case, when the price of the security reaches the trigger price, the stop-loss order is converted into a limit order and executed at the limit price itself or at a better price.
However, it should be remembered that even if the stop-loss order is triggered, there is no guarantee that the order will be executed if the price fluctuates very sharply.
What is Trading View and how can it be used to apply technical indicators in real-time trading? Describe the relationship between support and resistance levels and how technical indicators can aid in understanding these concepts. |
|---|
Trading view is a platform made for traders which works vastly and contains all types of assets of shares or cryptocurrencies or stocks. Traders can see various shares by applying various indicators on it. Many types of indicators are available. Traders can apply those indicators on any trading pair according to them and understand the market volatility.
Open the tradingview platform, and then choose your desirable trading pair on your preferred device . And specific indicators. And it will show you the increase and decrease in the prices range.
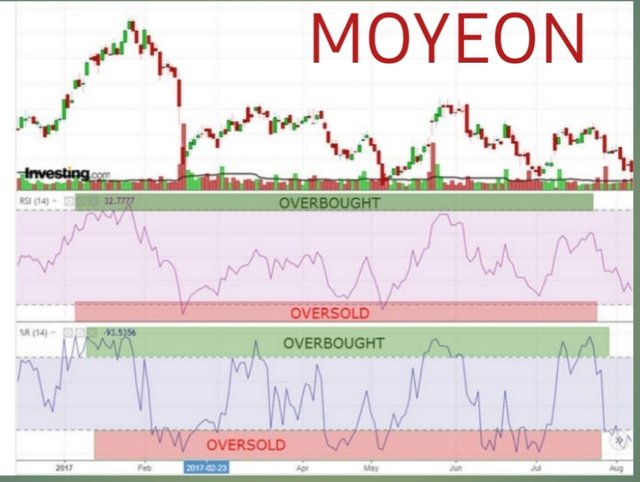
INDICATORS
I advice to use at least two technical analysis indicators.
When we use technical analysis indicators on the chart we should use a combination of at least 2-3 indicators. The best combination of technical indicators can confirm the movement while a single indicator can give false signals. We can avoid false signals by confirming the signals of other indicators with the price action.
Instead of indicators which generate similar signals, we should choose trading indicators that complement each other.
[Screenshot]
For example: We should not use Relative Strength Index and Williams %R together because both are leading indicators and both identify overbought and oversold areas. We can use MACD as a single indicator because it is a trend identifying and lagging indicator.
ADVICE FOR TECHNICAL ANALYSIS INDICATORS
There are many advisors especially who give various predictions about which stock to buy and which to sell. Before taking their advice in intro trade, we should study on what basis they are making the forecast. Everyone interprets the same indicator differently.
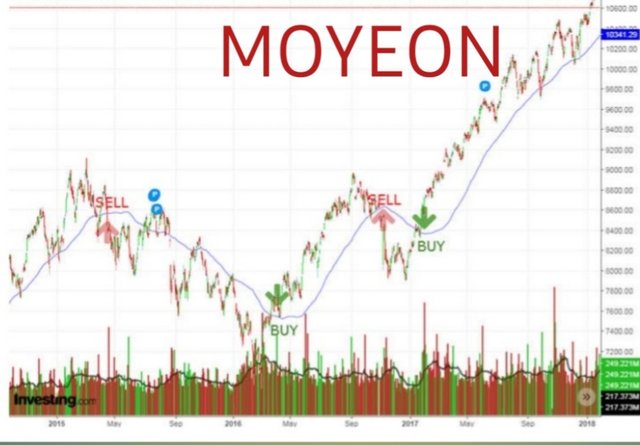
TECHNICAL ANALYSIS INDICATORS DIVERSIFICATION
We should never trade in a single sector or security. So we should diversify our trades in different sectors. As a result, our risk will also be diversified. We can gain from one sector and incur losses from securities in another sector.
For example, we have invested all our money in the oil sector. . Now we are feeling guilty why we invested all our money in the oil sector.
[Screenshot]
CHOOSE TECHNICAL ANALYSIS INDICATORS WISELY
It is impossible to analyze all these indicators for a single trade. We should set up our own trading system and analyze those technical analysis indicators that we understand and are comfortable with.
SUPPORT LEVEL AND RESISTANCE LEVEL |
|---|
Support level and Resistance levels are the backbone of traders. It illustrates significantly about the range of prices of shares.
In a layman language, the support level is the minimum price of an asset which cannot drop down below support level. It gives a traders the relief that it is the lowest price of shares and will not drop below this.
Resistance level is a maximum price of the Asset which acts like the ceiling of the house. Above which the range of a price cannot increase further. It gives the traders an idea to sell for the maximum profits. It is the higher and extreme price as well it is the best time to sell your assets and increase your profit margins.
Provide an overview of pivot points and discuss their calculation and significance in trading. Explain how to configure and trade with pivot points, including strategies for pivot point reverse trading. |
|---|
Pivot point indicators are very important levels for stocks, which act as indicators of support and resistance. Pivot points show us the psychological levels of the market, which are used by many traders as support and resistance levels.
CALCULATION OF PIVOT POINT
There are many ways to calculate Pivot point indicator. In this article we are going to discuss the calculation methods of the following types:
▪︎Standard Pivot Point
▪︎ Fibonacci Pivot Point
▪︎ DeMark Pivot Point
STANDARD PIVOT POINT CALCULATOR
The initial pivot point formula is the arithmetic mean of the maximum (H means High Price), minimum (L means Low Price) and close ( C means Closing price) of the previous period.
➨ This is what we call our base or standard pivot point (P):
P = (H + L + C) / 3
➨ Then we infer two levels of resistance and support from P.
➨ D is the difference between maximum (H) and minimum (L), so:
D = H – L
STANDARD PIVOT POINT FORMULA
•First Support Formula [S' = 2P – H]
•Second Support Formula [S'' = P – D]
•First Resistance Formula [R' = 2P – L]
•Second Resistance Formula [R'' = P + D]
Support and resistance are key concepts in almost all technical analysis. A popular technique to identify these levels in trading is to use pivot points.
Pivot points contain price information such as high, low and close, and are used to project potential levels of support and resistance into the future.
This indicator is used to identify important levels for bull and bear traders.
As soon as the market reaches these levels, there are two options:
➡️ Price bounce
➡️ Price break
Identifying where support and resistance levels are really useful skill that you can have predict price movement, and pivot points will help us with this.
Pivot points can be calculated "manually", or can also be done using the pivot point indicator MT4.
PIVOT POINT TRADING
Let us now look at the use of pivot points in stock trading.
Firstly, we can use our pivot point base as a way to predict the general direction:
◈ When the market price is above the pivot point base, it indicates that the trend is bullish.
◈ If the price is below the pivot point base, we can find ourselves in a bearish trend.
On the other hand, we can use our support and resistance levels to complete our trading strategy, based on which we can make specific rules:
➤ When to buy with pivot point ! Open a buy position when the Pivot Points indicator suggests a bull market or go short when the situation is bearish.
➤ Close long positions when the market reaches resistance levels, or close short positions when the market falls to support.
Alternatively, you can use support and resistance levels as position indicators to open positions:
➤ When you can sell when the market reaches resistance.
➤ When you can go long when the market falls to support areas.
CONCLUSION |
|---|
Trading is basically the buying and selling of stocks in a single day. The holding time in trading can range from a minute to hours. Deep understanding of shares can help to multiple their assets. It is possible with accurate information of market volatility and its contractions. You can do with a small amount of money through leverage.

Cc - @crypto-academy
Thankyou
India, May 25.05.2024
@moyeon
unfortunately @moyeon, your post contains plagiarism which is a prohibited practice in our academy which means that your account will be banned to participate in our next competition.
Hi @kouba01 and @steemcurator01,
You may or may not have seen my earlier comments which highlight this user's plagiarism - so it may or may not come as a big surprise that this is plagiarised too.
The original source is:
https://admiralmarkets.sc/in/education/articles/forex-indicators/what-is-pivot-point-in-trading
I've spent enough time on this user already so haven't looked at the entire article - You just need to search for the "Calculation of Pivot Point" in the above link and take it from there.
Unfortunately, it might be location blocked so here are a few screenshots:
I'm happy to find the original source of any other sections if you feel that it's necessary.
I thank you for the effort made to detect this part of plagiarism (written in hindi), it is really difficult to search for information in all languages, we are all united here to have a healthy ecosystem of fraud and plagiarism. Thanks again.
Thanks ✊ dear
You've given a good explanation of the topic that shows you've understood it quite well. Also, thank you for mentionimg the marubozu candlestick as I had never heard about it before
Thank you friend
Join the contest meet new people and strengthen your account..
Stand a chance to win a two week power up delegation
My Twitter link
https://twitter.com/moyeon_2401/status/1794404856527999415?t=J6DfnxrrTVC-b4EJzsRPLA&s=19
Join the contest meet new people and strengthen your account..
Stand a chance to win a two week power up delegation
In my opinion, trading with the trend is indeed a sound strategy. As a trader, by following the market's overall direction, we can align our positions with the prevailing momentum, which often leads to more consistent and profitable outcomes. It helps in minimizing the risk of going against the market's natural flow, making trades more reliable and less prone to sudden reversals.
I think this is a very practical approach to technical analysis. In my experience, using multiple indicators can provide a more comprehensive view of the market. Each indicator has its strengths and weaknesses, so combining them helps confirm signals and filter out noise, leading to better-informed trading decisions. It ensures that traders are not overly reliant on a single source of information, which can sometimes be misleading.
As far as I know, the concept of support levels is crucial in trading. These levels act as psychological barriers where buying interest tends to overcome selling pressure, preventing prices from falling further. As a trader, recognizing and understanding support levels can help us make strategic decisions about where to enter and exit trades, as well as set effective stop-loss orders to manage risk.
Good luck
I am grateful for your informative analysis on my blog. Thank you for bottom of heart for reading my post very deeply and dropping your valuable calculations on my research. Thank you a lot.
Join the contest meet new people and strengthen your account..
Stand a chance to win a two week power up delegation
Your post have described everything a man needs to know about technical analysis and I believe you spent day's making this post understandable. I'm so impressed about the different types of candlestick you mentioned in your post and trust me in my free time I'll come back to so I can have a better understanding. Keep exploring the world of crypto.
Best of luck..🤗
Thank you sweet friend @kidi40. I am grateful that you liked my blog.
Join the contest meet new people and strengthen your account..
Stand a chance to win a two week power up delegation
You have written a very deep post. I did not know many things, but I got to know them from your post. Thank you for giving so much knowledge about candlesticks and formulas and thank you for writing such a post. Please keep writing posts like this.
Thank you, blessings to you, best of luck ❤ 💙
Thank you friend
Join the contest meet new people and strengthen your account..
Stand a chance to win a two week power up delegation
Greetings @moyeon
You've carefully explained how the market works and it technical analysis. You must have spent lots of hours coming up with this unique and well understood content. I've been finding it difficult to understand types of candles in the market, but with this post, everything is well understood and I must thank you. Keep up the originality and quality in your content. Goodluck wishes 💌
Dear sweet friend @alli001,
Thank you very much for reading my post. I am grateful that you shared your thoughts and opinions with me. It is a big thing for me that you took out your time and go through my post. I am happy that atleast in some way, i could contribute to your learning in a little even :)
You have written about the significance of knowing technical stuff in trading well and it is informative. This captures the heart of technical analysis by stating main principles such as trend trading and market timing importance. Illustrations and practical advice make your explanation clearer. You did a good job!
Thank you for reading my post and showing your views here.
Join the contest meet new people and strengthen your account..
Stand a chance to win a two week power up delegation
Sorry @moyeon, your post contains plagiarism, is against the rules for voting.
@mvchacin - see comments above - you might want to remove the @steemcurator04 vote from this post.
Ok sorry i will remove the vote
Ready I remove the vote @steemcurator01.
Thank you for your lovely support @mvchacin ❤
Hello dear friend you wrote so well and I must say I really lent a lot from your article because it was filled with so much educational and knowledgeable data that could make one become profitable especially as a crypto trader.
Dear friend what to say is really true this is because no matter how hard you try or how hard to use technical indicators there will be cases where they fail you because the market is very very unpredictable as you say in fact I have been a victim of such incident..
Thank you dear friend for sharing such high quality content, I really appreciate such high quality content because it enriches the platform please do well to comment on my article through the link below 👇🏼 https://steemit.com/hive-108451/@starrchris/sec-s18-w1-or-or-mastering-the-markets-with-technical-analysis
Join the contest meet new people and strengthen your account..
Stand a chance to win a two week power up delegation