Trading Steem with the Wyckoff Method.
(2).png)
Friends, here we are to participate in the engagement challenge in the first week of season 20. I would like to thank the community and the administration team because every time they provide the contest with new and very important indicators. Without further ado let's go to our detailed post. We all know that important indicators are the most important for traders to determine the market position.
The Wyckoff Method is a form of trade as well as an investment strategy that was created by Richard D. Wyckoff in early twentieth century. It is directed on the market analysis in terms of supply and demand, price fluctuations and volumes. These three laws form the basis of this method and can be used to predict the fluctuating prices in the different markets such as the Steem token market.
- The process that explains the price changes in a product or service due to the availability of the goods and the people’s desire for it is known as the Law of Supply and Demand..
According to the Law of Supply and Demand price changes are due to changes whether in the supply of an commodity or the demand for this commodity. When demand goes up beyond supply, prices are likely to go higher whereas when supply is more than demand, prices are likely to drop.
When dealing with the Steem token, this law can be used as a way of predicting an asset’s price based on the market volume and user sentiment. For instance, if there is an increasing or rising interest or use of the Steem then the demand may sharply rise. We could also expect an increase in price levels, if the supply does not increase or even declines; for instance, if holders are adverse to selling. On the other hand if there is some negative news regarding Steem, its value or usefulness whereby there are more sellers than buyers, then the prices will drop.
- The said law states that there are reciprocal relationships between cause and effect.
Although The Law of Cause and Effect tends to hold that each bar can be attributed to some cause for its price movement, the notion most often used is that there are signs of accumulation-buying, which are capable of causing a price movement over a certain period of time. This law stresses the fact that wide swings in prices may occur after consolidation or accumulation and distribution stages.
Additionally, gears to look for in order to predict Steem token prices include; accumulation indicators whereby large investors bargain anonymously in order to accumulate the token and distribution indicators whereby large investors sell their holdings in the market. For instance, if ‘price continues to consolidate for a long time at lower prices with higher implied volume during the upward movements then it could represent accumulation by intelligent money buyers on the chart. This may result in a breakout where the price increases sharply as buyers rush to buy this commodity in larger quantities than its availability on the market after this build up. On the other hand if there exists distribution in the higher chart territory with declining volume during bearish trends then in most cases it may signal cues for lower prices.
- The Law of Compensation or The Law of Effort vs Result
Trading volume and price change relationship is analyzed in the Law of Effort vs. Result. If the firms decide on a significant change in the price, they should be followed by or accompanied by a large quantity.
If employed on the Steem token market, this law will assist traders in determining whether a price flitting is organic or possibly manipulative. For instance, if Steem’ price goes up yet volumes behind the price are low; then it may mean that there was weak buying interest and may soon reverse and drop as sell signals continue to tug at the high price levels. On the other hand when there is a steep rise along with good volumes it indicates that the buyers are willing to build sustainable up moves which mean that they have the power to push up the prices.
In summary:
Law of Supply and Demand: Describes how the changes in supply and demand impacts Steem’s cost structure.
Law of Cause and Effect: Avails differentiation phases that precede an accumulation/distribution phase culminating to a large price change.
Law of Effort vs. Result: Aims at determining to what extent prices have the adequate volume for support in any further movements.
All these laws give information on market psychology and the behavior of users in relation to the Steem token in its cryptosystem.
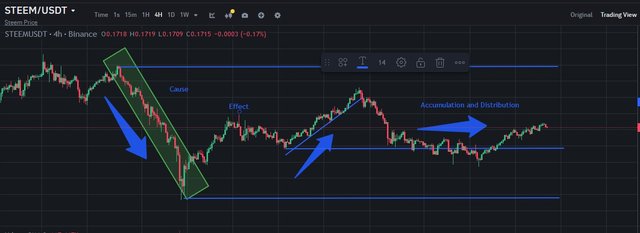
One of the concepts used in this theory is cause and effect whereby dramatic changes in price (effect) are likely to be triggered by accumulation or distribution phases (cause). This principle enable traders to predict future prices action looking at market places.
Cause: Accumulation and Distribution
When it comes to the Wyckoff Method measures of “cause” are expressed in relative values, which represent the accumulation or distribution phases. Accumulation may be described as when institutional investors ‘buy into’ an asset at lower price levels to form a base for the future rise in price. On the other hand, distribution occurs when these investors offload their stakes at higher prices thus a possible reduction in prices.
To try and express these phases numerically traders use volume analysis together with price trends. For example:
Volume Analysis: Looking at an accumulation phase one would anticipate the volume to increase as the prices settle and or even start to edge up after touching the lower end of the trend. This means that there are buyer traffic in the market which is an important factor in the appreciation of demand.
Price Action: During accumulation, the price may move in higher lows and higher highs suggesting an upward momentum.
Effect: Anticipating Price Movements
By “effect” we are concerned with the behavior of price as a result of an accumulation or distribution phase being concluded, or in other words, the behavior of price after a cause. If there was a huge building up phase where volume was high and the prices stable, there is likely to be an upward break out where prices are likely to rise sharply due to high demand.
For instance, let’s analyze Steem’s historical price data:
Accumulation Phase Example: It is assumed that there is a period of time in which Steem’s price was relatively stable at $0.17. Though only 0.15 of them with an upward progression of their volume across the several weeks. This could be interpreted as institutional investors stacking up on Steem tokens.
Expected Effect: After this accumulation phase what we may see is a breakout above $0. 18, 0.20 with significantly higher volumes (suggesting a new wave of buying pressure) we might expect that ultimately through increasing numbers of retail traders entering the market due to an optimistic outlook, Steem’s price might continue to rise.
On the other hand if Steem had peaked at one dollar then the trade-off would have been enormous. Of course, if something reached, say, 0.23 after such an accumulation and then began showing signs of distribution (decreasing volume while prices remain high), one might expect a subsequent decline in price as part of sell signals increase.
Therefore, having analyzed historical data in Steem, one understands how traders can use such Wyckoff Method’s basic principles of cause and effect to provide a forecast of price action in the asset accumulating or distributing phase.
The Law of Effort vs. Result is another principle that is quite common in trading which states that there exists a correlation between the amount of effort (or volume) expended towards buying or selling an asset and the resultant shift in the price. This can be especially noticeable in cryptocurrency markets for example, in the case where traders shift their position due to some news, sentiment changes, etc.
How to Avert Losses in the Steem Market; Usually, the Steem market is characterized by volatile trading volume and price fluctuations.
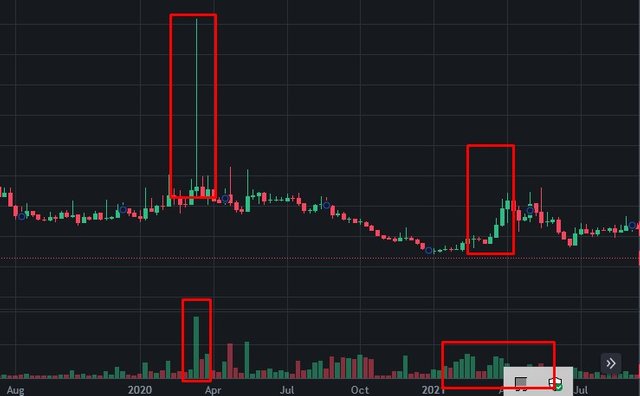
As an example of this law are, for example, the historical prices reflecting the exchanges of the Steem token. For instance, looking at the first quarter of the year 2021, price volatility occurred in Steem mainly due to its shifting governance and the sentiments of the community.
Volume Spike: As such, at this time, the volumes on Binance and Huobi, and other similar platforms, received a massive trading volume. This increase was due to higher demand sentiments from a normal investors and big fish through the news on the decentralised platform steem.
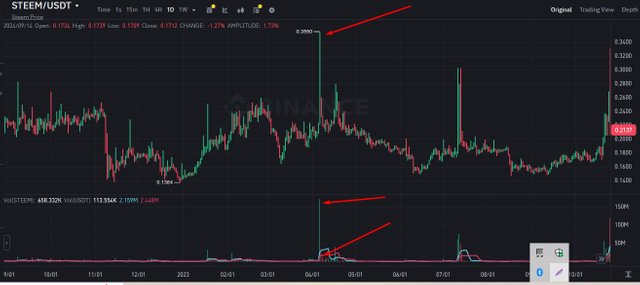
Price Movement: After this boost in volume, the value of Steem first increased rapidly from its value of approximately $0. 20 to approximately $0. 80 in a few days of the previous week as shown in the figure below: This rise has clearly stated that high trading volume meaning an increase in buying effort contributed to steep price change.
Subsequent Correction: Nevertheless, after trading had achieved its highest point of the current movement, it started to stage a correction due to traders who engaged in profit-taking after having bought the product on its early upward movement. Trading continued to be very high but this then fell as the interest in the stock reduced which in turn caused the price to fall back down to nearer to $0. 30 over several weeks.
Insights for Traders
From analyzing this example of Steem’s trading activity through the lens of the Law of Effort vs. Result, several insights can be derived:From analyzing this example of Steem’s trading activity through the lens of the Law of Effort vs. Result, several insights can be derived.
Volume as an Indicator: According to trading principles, volume could be used as an early warning signal by traders especially in trading volume. Especially, an increase in volume prior to the price move may be an open signal to the market that a large move is about to happen, irrespective of whether it is up or down.
Market Sentiment Analysis: Volume is important; if high volume is associated with positive events or news (such as changes in the project’s governance), then there may be a huge jump in the price of the project. On the other hand, high volumes may be a result of the stock price going up but in the absence of supportive news or else when negative sentiments prevail this may result to steep reversals.
Timing Entries and Exits: The weekly volume analysis also gives an emphasis on the effect of timing in trading by either entering a new position or exiting a trade. The volume traders may search for situations where they think that volume is increasing when the price is rising but they should also be aware of the risks of reversal of direction after an increase in prices.
Risk Management Strategies: Since high volume causes volatility, that is why the use of risk management measures is crucial for traders who trade with assets including Steem.
The Wyckoff Method is relatively a technical analysis that aims at identifying market cycles and prices based on the learner’s study on the application of the supply and demand values. The method consists of four key phases: amassment, mark-up, distribution and markdown. Also, each phase refers to a different phase in the life cycle of an activity of an asset’s price movement.
Accumulation Phase :
The accumulation phase follows a period of downtrend in which prices have bottomed and stabilize at lower levels for a long period. In this phase, intelligent shareholders aka ‘smart money’ start buying shares or tokens at prices they consider to be cheap. At this stage the prices are rather stable yet rather less volatile, while the demand has begun to rise and the supply is comparatively low.
For instance, with the Steem token which has been known to be witnessed at around $0 from late 2018 to early 2019. 30 to $0. 30, 25 and 50 after having plummeted from its record high of 40 to a low of 20. This period can be probably labeled as an accumulation phase, when many traders, who saw potential in Steem started buying it at these levels.
Markup Phase
After accumulation the markup stage is initiated when demand starts to exceed supply and there is an upward trend of prices. In this phase, many uneducated and inexperienced people come into the market and buy the asset due to the availability of positive signals at the market. Volume usually rises as the number of the buyers expands.
In Steem, after accumulation phase mentioned above, there is a significant price rising from early 2019 in which Steem went from around $0. 30 to over $1. 00 in several months time hence its importance for effective fiscal reforms to be realized. This shows that the increase of the price was a result of the markup phase whereby the sentiment was bullish and this pushed the price up.
Distribution Phase
Distribution phase comes in when smart money starts selling their stakes especially when the assets they invested in have experienced high levels of a markup. At this stage, supply outperforms demand as the initial investors who bought the assets at cheaper prices to sell them at higher prices to the late investors. This phase most often involves more fluctuating pattern in prices and can displayed some sign of deterioration in the buying power.
For Steem, the price reached it highest in mid 2019 to be almost 1$. 60, there was a subcategory of a period when prices started to form a major higher distribution trading range from which prices started falling: this is characteristic of holders who were realizing their profits.
Markdown Phase
The markdown phase comes after distribution and is characterized by a continual price drop since the pressure to sell dominates the desire to purchase. In this stage, the attitude is negative since the traders and/or investors may be experiencing loss, or are unsure of a rise in the price of the security.
After going into the markdown phase post-distribution for Steem for the most of 2020 and through 2020 and through nearly 2021 after having reached a high of around $1 and peaking towards $0. 10 that by the early months of 2020—this is a clear illustration of markdown strategy since the sellers are the ones in control of the market.
Identifying Current Market Phases
To identify which phase of the Wyckoff Method a trader is currently experiencing in any market (including cryptocurrencies like Steem), they can look for several key indicators:To identify which phase of the Wyckoff Method a trader is currently experiencing in any market (including cryptocurrencies like Steem), they can look for several key indicators:
Price Action Analysis: Seeing whether an assets price is rising or falling is assisting when trying to find out if an asset is following an upward or downward trend.
Volume Trends: Studies are made on trading volumes to be able to determine if it is more of buying or selling pressure.
Market Sentiment: It makes sense for traders’ mood; overall average market sentiment whether through analyzing the news or social media gets a feel as to whether traders are happy (markup) or sad (markdown).
Support and Resistance Levels: While trading, figuring out important support levels in the accumulation phases and important resistance levels in the distribution phases will help in the identification of switches from one phase to the other.
When used in conjunction with the historical pattern graphs similar to those presented with tokens including Steem, it becomes easier for traders to understand the current market situations.
Wyckoff Method is a kind of trading technique which determines when to enter into the market and when to exit from it based on the trends of the market and the prices. This method is effective especially when trading crypto-cash such as the Steem token. The following is a step by step guide in applying Wyckoff Method in terms of: a Accumulation Phases b Supply/Demand Tests and c Shifts to Markup Phases.
- Understanding Market Phases
The Wyckoff Method categorizes market behavior into four main phases: These include; Accumulation, Markup, Distribution, and Markdown. For trading Steem, it is crucial to recognize these phases:For trading Steem, it is crucial to recognize these phases:
Accumulation Phase: This is an intermediate phase where buying interest increases as compared with selling pressure.
Markup Phase: A phase where the prices begin to skyrocket as a result of high demands on the available resources.
- Identifying the Accumulation Phase
To identify an accumulation phase for the Steem token: To identify an accumulation phase for the Steem token:
Price Consolidation: Thus one should be looking at the display of a sideways pattern of price movement across some time frame. From this it be can deduced that buyers are accommodating selling pressure.
Volume Analysis: Finally, during this phase; volume may decline or show early signs of rising as price tests support areas.
Support Levels: Find reversal rates that is the levels, at which an upward movement after a down period is expected. For instance, if Steem keeps bouncing back to the $0. 20 in the course if several weeks, this could, hence, suggest an accumulation zone.
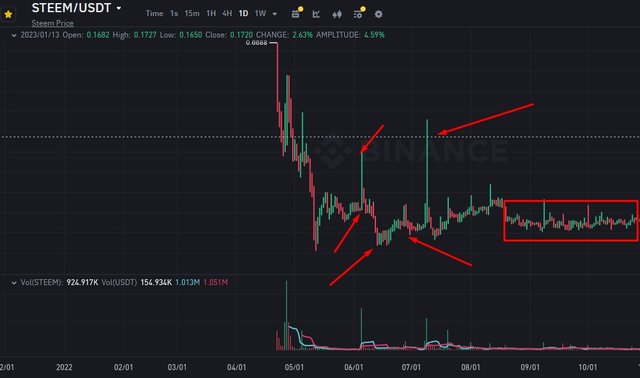
Example: Let's consider the market values of Steem from January 2023 to March 2023 which ranged as follows $0. 1516 and $0. 1853, although the volatility had decreased and the volume spikes happen at the lower prices, which may indicate accumulation.
- Signs of Supply/Demand Tests
After identifying an accumulation phase:After identifying an accumulation phase:
Demand Tests: Search for cases when price touches slightly the base of support level and rises again, which means there is demand.
Supply Tests: On the other hand analyse whether there are attempts to drive prices higher, which results in a failure in this endeavour as this may be viewed as selling pressure.
Example: If in April 2023, Steem temporarily goes to 19 cents but snaps right back to over 20 cents on high volume, that would be a sign of strength.
Transitioning to a Markup Phase
Once you have confirmed accumulation and observed demand tests:
Breakout Confirmation: A breakout occurs when the price moves above resistance levels with significant volume (typically at least 50% higher than average).
Volume Surge: Increased volume during upward movements confirms buyer strength.
It will indicate that the transition to an markup phase has occurred.Entry and Exit Points Based on Wyckoff Method
For practical application:
Enter when you see demand tests confirmed and then a breakout above resistance (i.e. enter at 0.23 after break confirmed).
Exit Point: Put your exit points where most recently there was a resistance or if you see signs of distribution (example : only taking 0.30$ but it’s looks to be reversing / lower volume).
In summary: Identify accumulation through consolidation patterns and support levels.
Confirm demand tests through quick recoveries from minor dips.
Look for breakouts above resistance accompanied by an increase in volume. This would indicate the beginning of a markup.Buy breakouts and sell near resistance.
The Wyckoff Method can offer useful insights when analyzing the price behavior of the Steem token during these stages based on a study carried out through an analysis of past data in early 2023.
An orderly way of trading Steem through a specific application can be defined as the Wyckoff Method that determines significant market phases: Accumulation, Markup, Distribution and Markdown. Traders benefit from studying price movements and volume to anticipate how the markets will behave, leading to educated decisions. Traders read tea leaves by understanding the fundamentals: supply and demand, cause and effect, effort versus result and put markets in-trend reversals or continuations. This method will allow you to time your entries and exits well and help in making overall better trades on this very wild cryptocurrency market.

Thanks to everyone here is an invitation @abdul-rakib @simonnwigwe & @josepha
X promotion link
https://x.com/mostofajaman55/status/1834911685909660042
Upvoted. Thank You for sending some of your rewards to @null. It will make Steem stronger.
Thank you for voting for @pennsif.witness - much appreciated.
Thank you very much we are always supporting & promoting @pennsif.witness.🙋♂️
0.00 SBD,
0.14 STEEM,
0.14 SP,
0.00 TRX
You have shared a comprehensive and informative post on predicting Steem Token price using Wyckoff Method principles. You have detailed principles like Supply and Demand Cause and Effect and Effort vs. Result which help traders understand market fluctuations.
This method enables investors and traders to better understand when to buy and when to sell. The examples you provided also made the topic more clear.
Thank you so much for sharing This post And sharing your knowledge with the community.
thank you so much.
With the Wyckoff Method, the alert will get higher.
You've done a great job explaining the Wyckoff Method in simple terms especially how the laws of supply and demand cause and effect and effort vs. result apply to Steem trading. It's interesting to see how the phases in the accumulation and distribution process can help us understand market trends. Your detailed breakdown makes it easier to grasp the technical aspects of trading. I'm sure this post will be valuable to many in the Steemit community. Good luck in the contest
thank you so much my dear friend.
You explained the method very well, going through each step carefully and in detail, which allowed me to learn more.
thank you so much my dear friend.