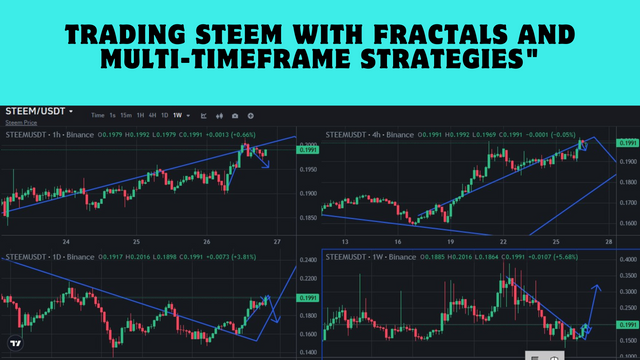
"Trading Steem with Fractals and Multi-Timeframe Strategies"
(1).png)
Greetings everyone, I am here to accept the engagement silence number for the third week of season 20. This time the topic is rading Steem with Fractals and Multi-Timeframe Strategies. I want to thank the Academy again for hosting the contest. Can learn the trade.
It is a geometric figure that has the same details on different levels of department and it is used in trading strategies primarily focused on multi time frame analysis. The fractals in trading concept is named after the mathematician Benoit Mandelbrot who adapted fractal geometry to trading platforms. It means that market movements are not random, they are self-similar in different time frames according to this approach.
(2).png)
Market fractals are models that have been developed from fractal geometry whereby geometry mapping is based on patterns, which may be recurrent at different scales. To the financial markets, fractals are patterns that can be used to determine when a certain trend is likely to reverse. The basic model is founded in the fact that patterns exist in space scales of minutes, hours, days, and years and all other scales between them are similar or fractal.
- Understanding Market Fractals.
Fractals in trading are mainly detected via definite patterns on price charts. A bullish fractal appears in a structure of consecutive prices and a higher central peak; two lower peaks are located at the sides of this peak as well. On the other hand, the establishment of bearish fractal is characterized by the presence of a central trough surrounded by two other but lower troughs. These formations practically indicate areas of possible reversals within the context of the market.
- Identifying Trend Reversals.
These fractal patterns are then used by traders to look for points of reversal of trends. Market traders make patterns like the bullish fractal shapes to be pointing towards an upcoming upward turn whenever they appear after a downtrend. Further, when an indicator such as a bearish fractal is made subsequent to an upward movement, it may be a sign that the market will start to pull down.
- steem use steem/usdt trading pair.
Bullish Fractal: In other words, the increase in STEEM could have been occasioned by its trading at a low of $0.20. After this low it goes up to $0.25 (the middle highest point) then goes back down to $0.24 and further to $0.23 (the next two small peaks). This formation depict a bullish fractal because it means there are buyers who are willing to buy at those levels thus helping push the market up.
Bearish Fractal: On the other hand, if Steem has been going up and peaks at $0.30, STEEM falls to $0.29 and $0.28, then that is bearish fractal showing that sellers may be overpowering, which is bearish.

Relative Strength Index (RSI): It is known as the momentum oscillator working with the velocity of price movements and is called the Relative Strength Index. It varies between 0 and 100 frequently termed as an ‘oscillator’ to detect either overbought and oversold levels. Incorporating fractals with RSI, one can find situations where price touches new extremes, while RSI does not reach for ones. This divergence can predict reversals.
Moving Averages: Like all other types of averages, moving averages help filter price information to recognize trends within given intervals. These include the simple and exponential moving averages for short and long terms such as fifty and two hundred day; the cross over technique to determine buy/sell indicators. Moving averages are utilized to consider cross overs that exist when fractal breakout occurs they allow traders see where moving averages are aligned to confirm the trend direction when combined with fractals.
Practical example of using Steem chart can be explained as follows. Let’s consider a hypothetical scenario using Steem’s price chart:
Identify Fractals: First, try to find the recent bullish and bearish fractals on the Steem chart. But if we discover bearish fractal at 0.20 after the formation of the second lower low. Two higher highs form a bearish fractal at $0.25.
Apply RSI: See the RSI value at these centers.
However, if the RSI is below the 30 level near $0.20 this would support our buy signal. On the other hand, if the RSI is above 70 near $0.25 this puts more weight into our bearish view.
Moving Averages: Look at moving averages.
While there is clear fractal breakout, if a short-term moving average crosses above a long-term moving average around $0.20, it replicated the recent upward moves and suggests powerful trend up. If at $0.25 there is a reversal where the short-term moving average crosses beneath the long-term moving average which verifies the bearish fractal breakout, then we could be heading downwards.

 |  |
|---|
Daily Charts: On daily time frames, fractals are used to identify short-term price fluctuations. A bullish fractal is usually constructed from five straight bars by observing that the middle bar contains the lowest low in that sequence, the higher lows on the two preceding and following bars. In the same vein, bearish fractal is formed when the bar in the middle is higher than both the first and the third bar but the second bar and the first bar have the same high surpassing the third bar, but not the first. These signals are usually used by traders in making the right entry and exit points for trading in anticipation of an upcoming market trends.
Weekly Charts: Weekly charts cover a larger range and give less regard to activities of the market on a daily basis. Fractals of the bullish and bearish nature that can be seen when looking at the weekly charts might show trends and possible reversal points which might not be so visible when working with shorter periods. For instance, if a bullish fractal is formed on the weekly chart while on the daily chart the bearish fractal may form that serves to say that while there might be a reversal to the downside in the short term, the long term outlook is still bullish.
Interaction Between Time Frames: About Daily and Weekly Fractals: Daily & Weekly Fractal Analysis offers traders a market overview. In other words, both time frames indicating bullish signals like bullish fractals indicate more positive evidence of upper price movement. On the other hand, if there is a buy or bearish signal on the daily chart and the weekly chart is bearish or conversely, the traders are careful or they may lag for a confirmation.
Daily Chart Analysis: Let us assume that you notice several days when prices create lower lows and higher lows in the next one or several days – this might signal possible bullish reversal.
Weekly Chart Analysis: Consistently rising buying pressure for more than a couple of weeks, which is true as we speak, implies that it may continue to rise in coming weeks despite minor fluctuations.
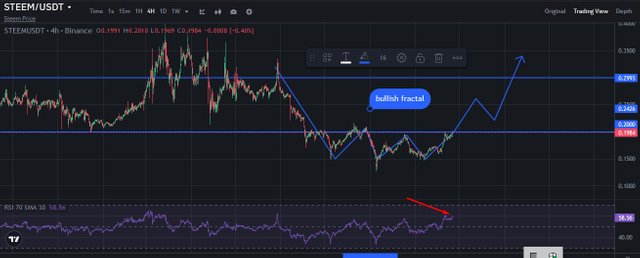
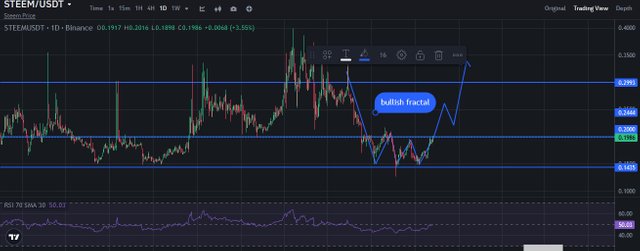 | 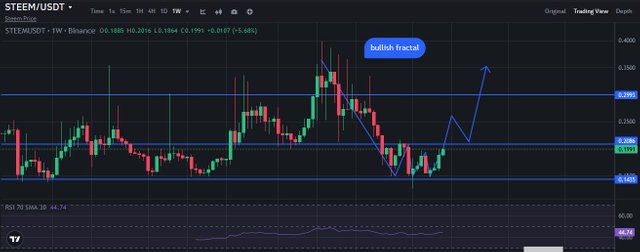 |
|---|
To design the efficient trading plan, start with studying price charts for the Steem token (STEEM) for the recent period on day, hour, etc. Look for bullish and bearish fractals:
Bullish Fractal: Look for points at which the middle candle is established at the lower low position as compared to the two previous and next candles.
Bearish Fractal: Find levels when the middle candle’s high is above the highs of both the previous and the next two candles.
- Entry Points
Long Entry: Go long when in a bullish fractal is confirmed. For instance if you see a bullish fractal at $0.20 you are going to open your trade there.
Short Entry: Go short whenever you have confirmation of a bearish fractal. If you find a bearish fractal at $0.25 you would take your entry point at this price.
- Exit Points
Take Profit for Long Position: Always set your take profit at least 1.5 to 2 times the distance you have measured as risk from the entry level. For example should you had started trading in the market at $0.20 targeting to sale at $0.24 it is wise to put a take profit at $0.28.
Take Profit for Short Position: Once more, determine how much in percentage to your take profit to your short trading position depending on your risk/reward ratios.
- Stop-Loss Levels
Establish stop-loss orders to manage risk effectively:
For Long Positions: The stop will be placed below the most recent swing low or below the last confirmed bearish fractal level of the chart For instance, if one entered at $0.20 and most recent swing low was $0.19, the stop will be placed around $0.185.
For Short Positions: To do this, you must position your stop-loss just above the most recently identified swing high or just above the last confirmed bullish fractal level, if you are going long at $0.25 and the last swing high was $0.26 then place your stop around $0.26.
- Assuming current market conditions show: weekly This is a bullish fractal that we can identify at $0.14. A bearish fractal formed at $0.29
You could execute trades as follows:
Buy STEEM at $0.14 with:
Take Profit Target: $0.28
Stop-Loss Level: $0.125
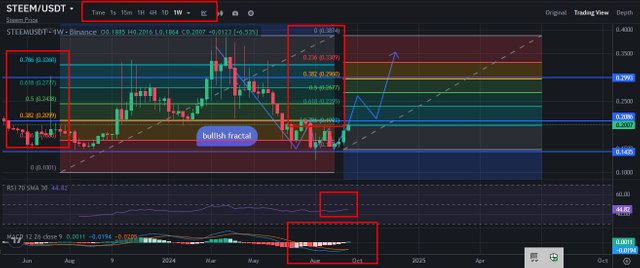
Before explaining fractal analysis in the context of Steem’s market position we need to explain what fractals are in the context of financial markets. Fractal analysis refers to the location of patterns that have the potential to reoccur at different scale levels for the purpose of price changes using past data. Where Steem and other cryptocurrencies are involved, fractal analysis can assist traders and investors determine whether the asset is currently bullish or bearish.
Market position of Steem in today’s unestablished market.I have used the Extra Fibonacci Replacement Level Indicator here to make the matter more clear. The price labels look more clear, hope you understand.
Fractal Patterns: Fluctuations in the prices of these cryptos are self-similar, where by similar patterns of volatility can be observed at different levels (daily, weekly, monthly). One can also deduce true support as well as resistance levels from the actual price charts of Steem which have been repeated in the past.
Bullish vs. Bearish Cycles: Bullish cycle always involves price direction that is upwards, with an influx of buyers while in the bearish cycle the prices are coming down with lots of sellers. If one wants to know where Steem is on a fractal cycle right now, one would try to identify some recent price action relative to these time frames.
Current Analysis: For instance if we analyze recent price movements and observe that fifty-two week cycle have highers high and higher low this might be an indication of a bullish phase. On the other hand, if the price is a series of lower highs and lower lows could very well mean the price is in a bear market.
Next Possible Moves: Based on fractal analysis:
This is if we are in a bullish pattern for the Steem; the next move could be the testing of the previous resistance levels or moving to a new high level.If it is in a bearish pattern, moving averages then show potential falls towards certain supports or creating new bearish breaks beneath the support levels.
I see through all the analyzes that our target is 0.29 cents in weekly pandal. 0.29 before some other price rates within our horizontal line such as 0.25 cents. Then we can see a small retest and reach our 0.29 cents target.
The social media application Steem that runs on the blockchain employs fractals and multi-timeframe strategies to improve the trading and investment forecast. In this respect, fractals describe patterns that repeat on different scale levels to help traders analyze tendencies for price fluctuations using historic data. For instance, multi-timeframe analysis pays attention to multiple time horizons with a view of studying the effect of price movements on markets. Combination of these concepts helps the traders to make better decisions and also works for short-term traders, giving them increased accuracy of their results, which is quite crucial when operating in the uncertain world of cryptocurrencies.

Thanks to everyone here is an invitation @hamzayousafzai @mohammadfaisal @simonnwigwe & @josepha
Upvoted. Thank You for sending some of your rewards to @null. It will make Steem stronger.
X promotion link
https://x.com/mostofajaman55/status/1839335598911586573
I will post my entry tomorrow.. its almost.finished
we are waiting for you my friend. thank you so much for respond.
Wow you have presented a wonderful entry while trading STEEM/USDT with the help of the fractals. This trading strategy is very helpful to spot the turning points in the market. WE can determine the entry as well as exit points with the help of this strategy.
Moreover the implementation of the other indicators with the fractals help us to confirm the market reversals.
Best wishes for the contest. My entry is also coming soon I am in the completion phase of my entry as well.
I know my brother your entry is soon in fact more brothers also. thank you so much for your valuable comment.
You have done a great job explaining the concept of fractals in a way thats easy to follow especially how they help in identifying potential trend reversals. I also appreciate the practical examples and the combination of fractals with indicators like RSI and moving averages for a more effective trading strategy. This analysis is both insightful and useful for anyone interested in trading. Good luck with the contest
hey my dear friend thank you so much for your valuable comment.
my pleasure
I have learned a lot about market fractals with your help! Traders should look for bullish and bearish fractals to know when a trend reversal may occur. For Steem/USDT, a bullish fractal at the $0.20 level point to buyer order flow, owing to the subsequent increase of the price. On the other hand, a bearish fractal at $0.30 shows that sellers are dominant and the price might soon trend down. Fractal analysis can be used in combination with other sources like RSI and moving averages in order to improve trading strategies and decisions. Great analysis!
thank you so much for your feedback.
This post of yours elaborates on fractal analysis in financial markets and their use in different time frames. Fractals are actually patterns that appear on price charts to indicate trend reversals. With the help of bullish and bearish fractals, traders can find potential reversal points and understand price volatility.
You also Explain the Combination of Fractals with various trading indicators like RSI and moving averages, to create better trading strategies. Also how fractals can be used in Different time frames and how they reveal market trends.
Overall This is a useful post to help understand The use of fractals and their importance in Trading especially for those Trading cryptocurrency pairs like STEEM/USDT.My Best Wishes for you
My dear friend thank you very much for viewing my post and nice comment best of luck.