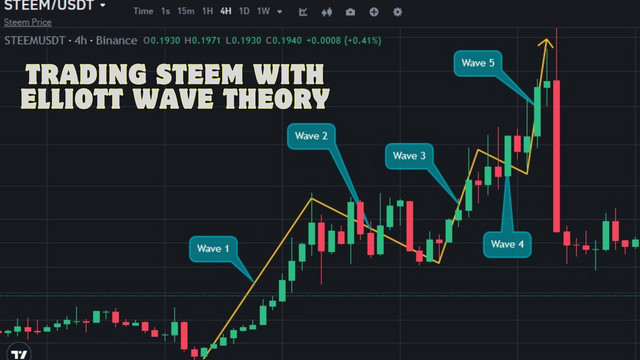
Trading Steem with Elliott Wave Theory
.png)
Greetings everyone friends hope everyone is well I'm fine I'm here to participate in the second week of Crypto Academy's 20th season engagement silences. This year's topic is about a theory created by Elliott. The theory is really very effective. I am trying to tell you about it step by step.
In the 1930s, Ralph Nelson Elliott developed the Elliott Wave Theory as a form of technical analysis according to which markets move in repetitive cycles influenced by investor psychology. In the view embraced by this theory, markets go through five upward waves and then correct with three downward ones to read 12 to the bottom. In this manner, the cycle is complete. Elliott discovered that these patterns are a reflection of human nature. What's more, they provide signs for possible future market trends. Elliott's theory emphasizes the fractal nature of markets. This means that certain patterns recur at all scales, making it possible to predict potential entry and exit points based on historical price movements.
There are five sub-waves of impulsive waves which are labelled 1, 2, 3, 4 and 5 according to their order of formation. Each of these wave has some unique features:
Wave 1: It is often the first wave to emerge marking the start of an upward price trend. It is always ignored as it takes place after a long period of downward price movement. In most instances, wave 1 is the point of the break in trend and normally has the least price movement that prepares the way for the development of the bullish trend.
Wave 2: After the completion of wave 1, this wave is the corrective wave that reaches a proportion of the price increase registered in wave one but does not go beyond the point of departure. Usually, wave 2 often retraces 50% up to 61.8% of the length of wave 1.
Wave 3: This is usually the largest and strongest wave formed in the impulsive sequence. It usually goes beyond the peak of wave 1 and has sharp movement and great volume since the market became optimistic with traders looking to buy and pushing the price higher.
Wave 4: This wave is also a global corrective phase but usually not so deep as wave 2. This wave covers a portion of the gains of wave 3 usually around 38% to 50% of wave three but will not end within the price range of wave one.
Wave 5: It is the last stage of any impulsive pattern, where the market pressure finally climaxes and a reversal in trend comes about (the onset of a downturn). The wave may exhibit signs of exhaustion (like a waning volume) but still forces prices high
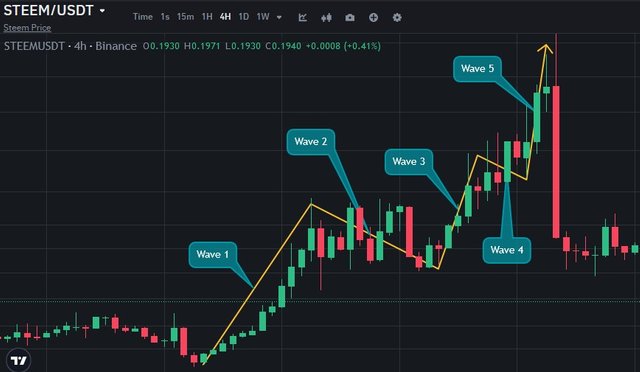
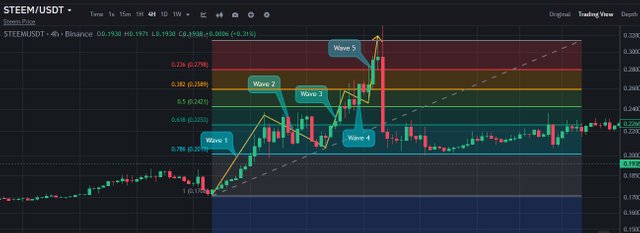
STEEM experiences an upward movement where:
- Wave 1 sees an initial rise from $0.1717 to $0.2321.
- Wave 2 then corrects back down to $0.2097.
- In Wave 3, STEEM surges up to $0.2579 with significant volume.
- Next, during Wave 4, there might be a pullback to $0.2464.
- Finally, in Wave 5, STEEM reaches $0.3106 before entering into a correction phase.
For a more precise study of the price history of Steem, the majority of researchers would turn to the methods of technical analysis, and in that, to the Elliott Wave Theory. This theory maintains that there are ebbs and flows of market prices that can be referred to as impulse and corrective waves.
Impulse Wave
The implication wave consists of dramatic price movements in the direction of the trend. It is typically composed of five sub-waves with 3 upward sub-waves in a bullish trend and 2 downward corrective waves in between. The following points can be taken as features of Impulsive waves:
Direction: They are in the general direction of the dominant trend.
Volume: In most times, impulsive and non-imperative waves are recorded with high trading volume involved.
Momentum: In these waves, an increasing pattern is apparent and can be visually displayed with applications like RSI and MACD.
In the historical price chart of Steem, an impulse wave should be noticed, especially when a sudden rise in the price comes immediately after a consolidating phase which is often characterized by the pattern of higher highs and higher lows.
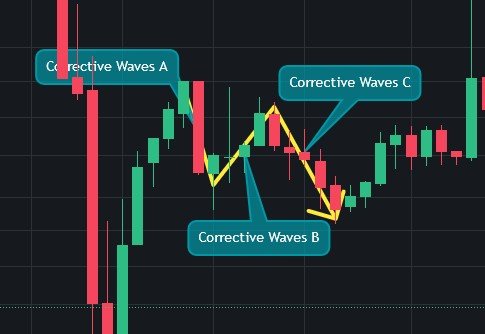
Corrective Wave
In the context of correction, corrective waves are a price movement in the general direction that goes in the opposite direction of the main category and is comprised of three waves (A-B-C). Their characteristics include:
Direction: They travel in the opposite direction to the major trend.
Volume: Corrective phases usually experience
The alternation rule is one of the major concepts of Elliott Wave Theory that states that waves within a corrective pattern are different in structure. This means that, if one corrective wave is a simple type, the next one will be a complex type, and if the first one is complex, the second one will be simple. In Elliott Wave Theory, corrective waves are classified into two main types: basic corrections (simple as zigzags and flats) and the more complicated ones (double or even triple combinations).
Simple Corrections: These usually come in three waves (A-B-C) and can be formatted in the following ways:
Zigzag: A sharp correction with a clear structure of 5 waves up followed by 3 waves down and then another 5 waves down.
Flat: This is sideways correction in which A and B waves are more or less of equal length.
Complex Corrections: These include more complex structures which may include a combination of several corrective patterns.
For example:
Double Zigzag: Two zigzags linked by a wave in between.
Triple Combination: Three different corrective patterns were used simultaneously.
According to the alternation rule, when a market has a simple correction, the following correction will be complex and enable traders to predict further price movements. Effect on the Trading Approach for the Steem Token
Using the alternation rule in trading strategies for cryptocurrencies such as Steem, traders can predict future price changes to correct structures. If Steem has a simple correction after the bullish trend, like a zigzag, it is possible that the following phase will require a more complicated correction. This could affect their buying and selling points while trading for example.On the other hand, if Steem has just finished a complex correction (for instance a double combination), then the next move may well be relatively straightforward and thereby enable traders to place their trades as they deem fit.
Thus, studying the historical price charts of Steem through this perspective, the traders would be able to predict the future wave formations in the market.
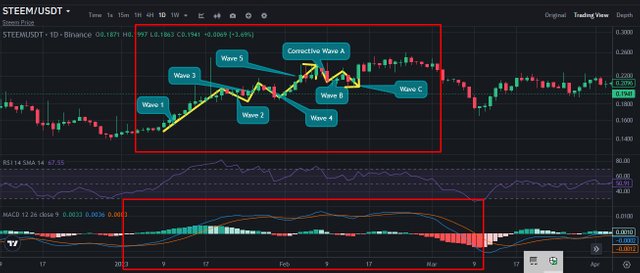
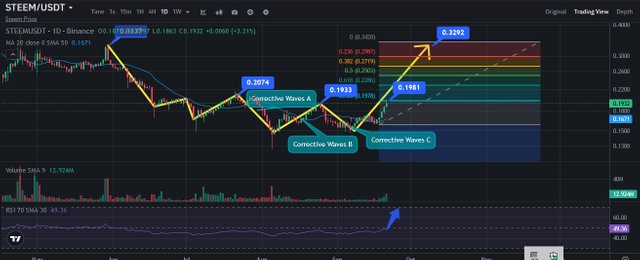
Steem chart example of Complex vs Simple Correction. To illustrate this concept using actual price data from Steem:
Simple Correction Example: For instance, we notice that after a steep rise in the price of Steem to $0.50, it experiences a correction sideways to $0.30 (A-B-C). Here:
- Wave A decline from $0.2981 to $0.2440.
- Wave B pulls back up to $0.2852.
- Wave C then falls down again to $0.2307.
Complex Correction Example: After this simple correction let’s assume that Steem moves to a more complicated structure, where it first draws a double zigzag pattern after reaching the $0.40 level.
The first zigzag brings it down even below $0.40 to $0.35 (A-B-C).After some consolidation around this level, another zigzag takes it down to $0.30 (A-B-C).This way, understanding these patterns is beneficial for traders as they can change their approaches depending on the fact that simple and complex corrections tend to follow each other. All in all, knowing the manner in which the alternation
Learning The 1-2-3-4-5 Impulse Wave Structure in the Market. The Elliott Wave Theory states that the market can be subdivided into waves. In an impulse wave, there are five distinct waves:
Wave 1: The initial move up.
Wave 2: A wave that moves in the opposite direction of the first wave to at least some degree of the initial wave.
Wave 3: The largest and the strongest wave which extends beyond the termination of Wave 1.
Wave 4: The other corrective wave that may move in the opposite direction and take back some of the gains of Wave 3.
Wave 5: The final push upward.
After these five waves, an A-B-C correction typically occurs, which consists of:
Wave A: A downward movement.
Wave B: A corrective upward movement.
Wave C: A final downward movement.
It is also important to note that the Waves can be tracked on TradingView through the following chart: Binance trading view To plot these waves on Trading View for Steem.Determine the beginning of Wave 1 from the historical price chart. Drawing trendlines or applying the Fibonacci retracement levels is an efficient way to mark each subsequent leg’s high and low.
Entry and Exit in Every Wave
Wave1:
Entry Point: You should go long in the beginning of Wave 1 when price breaks through the upper resistances.
Exit Point: Place a target at the end of Wave 1 with the help of Fibonacci extension levels like 161.8% level.
Wave 2:
Entry Point: Wait for a pull back towards the Fibonacci levels (normally between half to two thirds of Wave 1), before going long again.
Exit Point: Leave the system either before the beginning of Wave 3 or at the beginning of wave 3.
Wave 3:
Entry Point: It is advised to enter at the beginning of Wave 3 as it sweeps through the high of Wave 1 with price breakout to confirm strength in momentum.
Exit Point: Fibonacci extensions should be used again to set targets (for instance at the end of this wave, one should consider taking profit at around 261.8%).
Wave 4:
Entry Point: Similar to earlier corrections, search for a pullback to the Fibonacci levels; 38.2 percent possibly up to a maximum of approximately 50 percent.
Exit Point: Be ready to leave as you get to the end of this corrective phase.
Wave 5:
Entry Point: Always enter the market once it has been established that a price action is resuming its uptrend after completing
Exit Point: Continue the potential price targets at the higher Fibonacci extension levels (for instance, at the previous highs or at least the next major level at 423.6%).
A-B-C Correction: Expect A-B-C correction after the impulse waves:
Wave A:
It may be accompanied by a significant sell signal; it might be appropriate to take short positions if the technicals point to bears.
Wave B:
It is usually a secondary reaction; it can give some short covering or small longs if more buy signals are seen.
Wave C:
This is where we would be trying to find confirmation to go short again as it typically results in new lows. For all entries and exits, always set stop loss just below key support resistance levels that you have identified from your analysis.
Utilizing Fibonacci Levels
Fibonacci retracement and extension levels are crucial in determining potential reversal points.for each wave’s entry/exit strategy, apply Fibonacci tools from significant swing highs/lows:
For example, if the first wave is between $0.10 and $0.20 you should use this range in order to measure potential retracement levels for the following waves. Hence, by practicing these strategies in the right way and at the right time by keeping an eye on the market trends and sentiments on TradingView, traders can make the right decisions about Steem.
A Look at the Steem Market Today
- Identifying Recent Price Movements:
In the last few months, Steem has been ranging between support and resistance levels. The price has been fluctuating from one specific level to another, which suggests that it has formed a consolidation pattern. If we look at the most recent major upward move followed by a pullback, we can begin the process of attempting to identify waves.
- Wave Structure Identification:
Based on the assumption that the last major up move is wave (1-5), we can then look for price action that might suggest a corrective pattern is being formed.If we have a series of lower highs and lower lows after a peak, this might suggest that we are in a correction at the moment (A-B-C).
Technical Indicators:
Relative Strength Index (RSI): The RSI is a momentum indicator that measures the velocity of price action on the graph. An RSI above 70 is considered overbought and RSI below 30 is considered oversold. Presently, if the RSI is ranging between 40-50, it can be indicated that there is still some downward potential before it becomes oversold.
Moving Averages: Moving averages makes it easier to see price trends as it eliminates certain fluctuations in price data. If the short term moving averages such as the 20 day moving average is below the long term moving averages such as the 50 day moving average then this could point to bearish sentiment.
Current Position in Wave Cycle:
Looking at the charts and given that Steem likely completed an impulsive wave up to the recent high followed by a series of corrections, the current situation in Steem seems to be another correction. This could mean that we might continue to notice further declines before we record another upward movement.
- Next Possible Movements:
Thus, if Steem remains to follow this corrective pattern, it could target previous support levels before potentially switching to another impulsive wave up. It is advisable to pay close attention to the key support levels; should these levels not collapse, there could be some rebound towards the higher resistance level. Having considered the Elliott Wave Theory and the technicals like the RSI and moving averages, it may be deduced that Steem is undergoing a corrective mode after having enjoyed an impulse wave up move. Subsequent directions will be determined by whether or not support levels of interest will be held or breached . Steem is now trading as expected within a corrective structure based on the Elliott wave theory and any further movement will depend on the support or resistance levels.
Looking at the date 5th August 2024 we have seen all time low price in candle list from steem price currently accumulation is increasing and it is going upend which we can see when looking at the price. Observing all the webs and patterns shows that its next target is 0.33 which we previously dropped from there. Analyzing the candle weekly candle and all the hourly candles we see the price dropping but now we are going to the other side and hope it is very Will cross 0.33 in no time.
Thus, applying the Elliott Wave Theory for trading Steem can be beneficial for a trader to make correct decisions based on the market trends and possible reversals. Understanding the impulse and corrective waves enables the trader to determine where to enter or exit. The theory when combined with Fibonacci retracement levels helps in identifying major support and resistance zones. In conclusion, this analysis provides a useful framework for traders to better understand the cryptocurrency market and ultimately make better trades.

Thanks to everyone here is an invitation @abdul-rakib @simonnwigwe & @josepha
X promotion link
https://x.com/mostofajaman55/status/1837515527688015926
Upvoted. Thank You for sending some of your rewards to @null. It will make Steem stronger.
💯⚜2️⃣0️⃣2️⃣4️⃣ This is a manual curation from the @tipu Curation Project
@tipu curate
Upvoted 👌 (Mana: 3/7) Get profit votes with @tipU :)
I really appreciate how you've broken down each impulsive and corrective wave with clear examples especially in the context of Steem trading. The way you described Wave 3 as the most powerful and Wave 5 as the signal of a reversal is spot on. It's also helpful to see how the alternation rule plays a role in predicting market movements. This is valuable information for anyone looking to trade effectively. Good luck with the contest
thank you so much my dear friend for your valuable comment.
This is an exceptional breakdown of Elliott Wave Theory, especially with how you applied it to the Steem market! The detailed explanation of each impulsive wave, along with the real-world examples, makes it easy to follow. I particularly appreciate the use of Fibonacci retracement and extension levels to predict potential price movements. Your insights into the alternation rule for corrective waves really clarify how traders can apply these patterns to anticipate future trends. Great work on the analysis — looking forward to more posts like this!
thank you so much my dear friend.
The first impulsive wave is always terraced by the second in the Elliott Wave Theory. If the correction of the 2nd corrective waves is sharp then the correction of the 4th wave will be complex and sideways. Similarly this concept can be applied in opposite direction as well where if the corrective wave 2 shows sideways correction then the corrective wave 4 will show sharp correction. Best wishes.
Thank you very much for reading my post and commenting thoroughly I tried to present the indicator properly.
You are welcome
You provide step-by-step explanations of each wave, including A-B-C corrections, for effective action by traders. An emphasis on stop-loss setting and the need to use extension levels to identify Fibonacci retracements and potential reversal points is key to risk management. Your practical example, for example, retracement levels from relevant swing highs/lows were better than a certain level of resistance presented in the profit and loss report to holders.
Thank you very much for reading and observing my post and I applaud you for participating.