SEC S18-W5 || Mastering Trading with Stochastics and Parabolic SAR
Hello Crypto Lovers hope you all are well I am fine. Today I came to participate in the engagement challenge of season 18 week 5. The Stochastics and Parabolic SAR indicator is really brother and sell and indicates whether the market is overbought and oversold. Anyway, this contest has been given on a very beautiful topic. Let me start.
The Stochastic Oscillator is a technical indicator that is widely utilized by traders in their attempt to determine the level of overbought or oversold the particular stocks is. It consists of three main components.
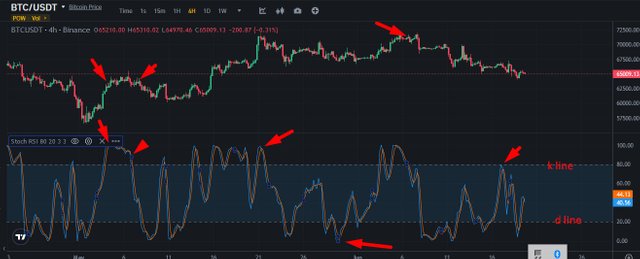
K Line: The K line developed by Welles Wilder refers to the current closing price relative to the high-low range within a specific period, usually 14 days. It measures the velocity of price movement or trend strength.
D Line: The D line is an average of the K line where one draws the moving average of the k line as it moves in a forward direction. It acts as a smoother to the K line, and also gives direction for trends that may also be trading indicators.
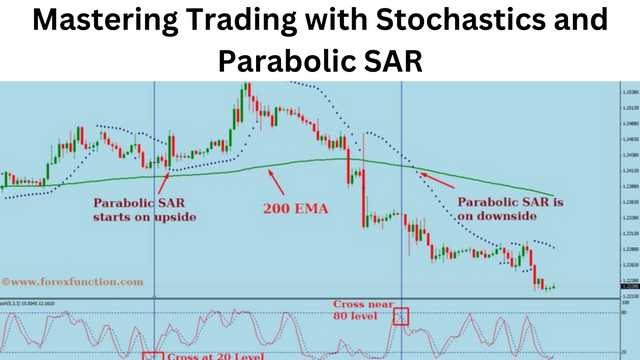
Overbought and Oversold Levels: Being a momentum indicator, Stochastic Oscillator operates with two fixed levels, 80 on the top for the overbought level and 20 at the bottom for the oversold level. If the K and D lines go above 80 then it means that the market is extremely overbought and a reversal or correction of the trend is likely to happen. On the other hand when the K and D lines fall close to the lower end of the graph it signals to the trader that the market is oversold and that one can expect a bullish outcome.
By combining the K and D lines, forming an indicator, and comparing them to of the overbought/oversold level, a trader is able to anticipate the buying/selling points of the market. It assists the respective trader to get the strength of a trend, when it is likely to reverse, and when the trader should make won decision.
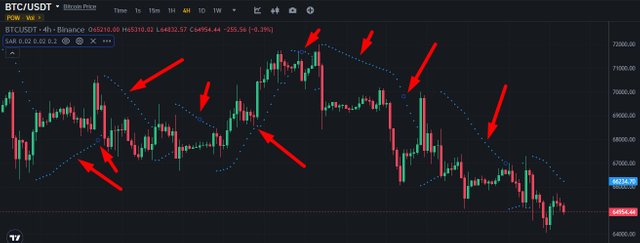
The Parabolic SAR (Stop and reverse) is another technical tool applied to analyze trends and especially the possibility of a trend reversal. It is depicted by a set of vertically placed dots above or below a price chart. Parabolic SAR is used in an uptrend in which the dots on it are placed below the price chart. Actually, they start at just a price below and above the trend as the trends goes up and up. The dots are very helpful; they work as simulated trailing stops that double up as support levels. This is so only if the price remains above the dots, so that the uptrend remains firmly in place. In the event that the price falls below a dot on the Relative Strength Index, it could be an indication of either a reversal of the trend, or an appropriate time to take off long positions.
The Parabolic SAR indicator plots dots below the chart during an uptrend and above, during a downtrend. They begin at a position higher than the price value, and as the bear trend emerges, they come down in progressive steps. The dots are in fact, trailing stops, which at the same time are balancing their resistance. The key premise to sustain this outlook remains the price below the dots line. When the price gets to touch a dot, it can be interpreted as a sign of reversal or an indication to go short when it breaks down.
While in an uptrend, the Parabolic SAR is used in the opposite manner where the buy signals are generated from the top referring to figure 3 below The Parabolic SAR is used differently during an uptrend and downtrend for buy and sell signals respectively. In an uptrend, the dots represent the previous levels of stop-loss, hence showing the points that can act as support and where the traders can re-adjust their stop loss levels. On the other hand, in a downtrend resistance is applied whereby the dots act as a signal for where the trader might wish to adjust their stop loss or seek further shorting opportunities.
In summary, the Parabolic SAR as a valuable indicator signals the trend direction and potential reversal levels. A trader uses the indicator to biennial his positions, place his stop loss and even make trading decisions depending on the direction of the existing trend.
The trading strategy that is formed with the help of the analysis of the Stochastic Oscillator and Parabolic SAR is quite solid and effective as it is based on the combination of the signals of both momentum and the trend. Here's a detailed explanation of how it can be implemented.
Trend Identification: Another usage of the Parabolic SAR can be to analyze the primary trend direction. If the SAR dots lie below the price chart, then it signifies an upward trend while SAR dots above price chart affirm a downward trend. - This information can then be valuable to traders so they can emphasize trades that cohabit with general trend. For instance, in an uptrend, they try to buy (go long) when the indicator of overselling is given by the Stochastic Oscillator and in a downtrend, they look to sell (go short) when the Stochastic Oscillator suggests over-bought condition.
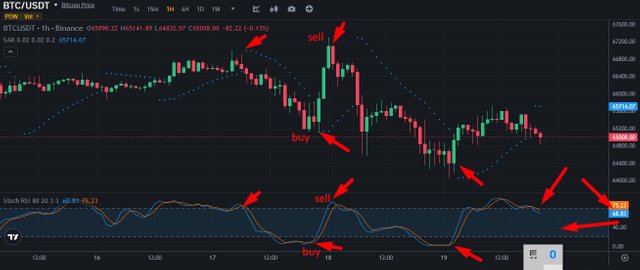
Confirming Momentum: Expressed in terms of stochastic oscillator, the Stochastic Oscillator can be used to determine the overbought or oversold level of the trend. When the oscillator drops below 80, such condition implies that the market has reached its overbought level and a reversal or correction may soon occur and when it goes below 20, it implies conditions of overselling. - The directional movement can be further confirmed by the trends indicated by the Stochastic Oscillator when it is initiated with a momentum signal from the Parabolic SAR. For instance, when in an uptrend, a cross below of the Stochastic Oscillator placed at 20 may be a reliable buying signal especially when prices are close to the SAR dots, which may be a sign that the price is rebounding at the support line for the referred trend.
Entries and Exits: When in trend the direction is up and the dots of the Parabolic SAR are below price, oversold signals may be bought (going long) as the Stochastic Oscillator rises above the slow line and crosses over the fast line at 20. - Likewise, if the Parabolic SAR dots are below the prices and signaling oversold condition, sellers (shorts) might be triggered when the oscillator penetrates 20-line from the upside. - It is also crucial that traders may employ the SAR dots to act as trailing stops to lock profits or dispose of a trade. For instance, by observing a downtrend and price breaking a SAR dot to the downside, it indicates the possibility of a reversal or if to close long positions.
We are now ready to define our trading system. it uses the Stochastic Oscillator and the Parabolic SAR to make entries and momentum checks respectively about the prevailing trend. They can also use effective risk management tools, the trailing stops, in reference to the SAR dots, to ensure that their profits are not only secured but also to control the trades adequately. Bear in mind that no method is a certainty you have to backtest and confirm the strategy by generating its history to ensure success in a real environment.
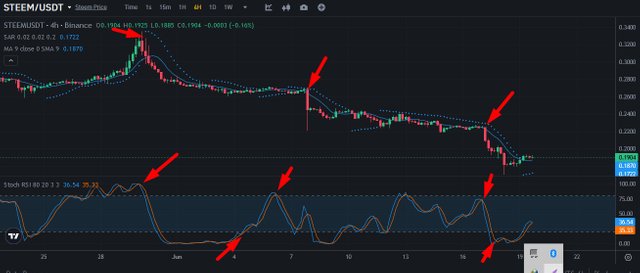
STEEM/ USDT on the basis of Stochastic Oscillator in the bearish region and further touching the oversold position coupled with Parabolic SAR. Please, do not take it as a commercial offer; it is just an example of potential trading scenario: Always analyze the real market data and consider other factors before entering the trade.
For instance, you are processing historical records for the STEEM/USDT pair; the Stochastic Oscillator utilized in this instance has just delivered an oversold signal. This suggests that the market is in a position to experience a probable reversal where the prices bounce back up.
To make a trading decision using this information along with the Parabolic SAR, you can consider the following steps:To make a trading decision using this information along with the Parabolic SAR, you can consider the following steps:
Trend Identification: Incline your chart to the right and look at the dots of Parabolic SAR against this piece of the price chart. This is the case when all dots are located below the price, which indicates that an uptrend has occurred.
Price Confirmation: Things to look out for when using such oversold condition from the Stochastic Oscillator indicators are outlined as follows. For example, look if the Stochastic Oscillator is reversing from the oversold leg while the atual price line is in the upward direction such as when the Stochastic Oscillator has crossed above 20.
Entry Decision: Parabolic SAR must also be in a buying area such that if the Stochastic Oscillator moves above the oversold area while the price is close to and above the Parabolic SAR dots, this could be a good buying signal. - Many users set stop loss or a take profit based on their risk appetite at which they either initiate or confirm a trade based on a candlestick pattern or breakout above the resistance levels.
Risk Management: – Use a stop loss at the needed swing low or at the chartist’s support level. - A trader may also choose to employ the Parabolic SAR dots for placing stop loss levels and managing the trade the best way possible as the price continues to make moves in the trader’s favored direction.
WriteIt is important to have in mind that this strategy should not be used when making trading decisions exclusively. In all cases, when analyzing the situation, it is always advisable to carry out a detailed analysis, compare multiple criteria, evaluate the risks, and manage with the aid of suitable methods. Also, past results can be no guarantee of future performance and importantly the climate alters considerably. It is always advised to bear in mind the current trends in the market.
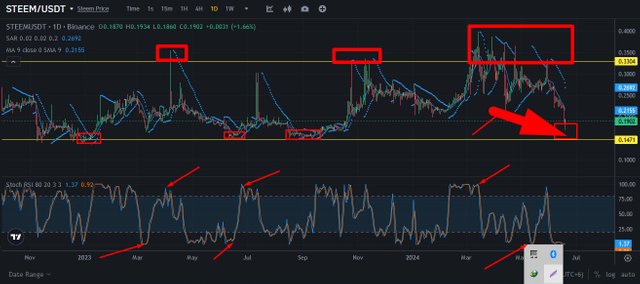
Everything in the screenshot of my draw shows crystal clear what the price range will look like. I took it and then using the Stochastics RSI and SAR indicators we got the information that we are currently in a support zone and from here the price of Steem can reach 14 cents and we can see the candlestick of this support day.
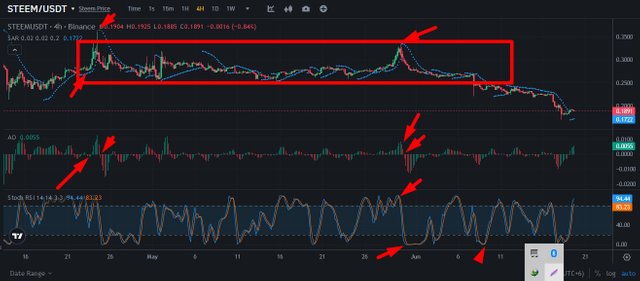
Analyzing the four-hour time frame, it appears that the price of steem is limited in a strong support range and horizontal line. But anytime it can break out 20 to 24 cents. Because currently the BTC price is accumulating and is in a down train, so all bitcoins are in a down train. But it is very strong to say that if btc breaks out a bit, every token will go back to the previous price range. Look closely at the dots and red triangle indicators and you will understand.
This was my analysis and hopefully it will be completed in a very short time. I'm ending my post here everyone stay well stay healthy.

Thanks to everyone here is an invitation @hamzayousafzai , @sahmie ,@stream4u
Great job @mostofajaman!
I feel that you have explained the Parabolic SAR in an exemplary manner and I am grateful to learn from such an incredible explanation. Let's break it down further:Let's break it down further:
Parabolic SAR Basics:
Uptrend Application:
Downtrend Application:
Risk Considerations:
However, it is crucial to comprehend that the Parabolic SAR is better to be used in combination with other indicators to make the choice between buying and selling beneficial. Happy trading!
thank you so much for your nice explanation comment. best of luck to you.
Very nice information you shared on Stochastics and Parabolic SAR indicator. Its really helpful the way you described about Stochastics and Parabolic SAR, the strategy by combining these both indicators, trend conformation.
By the way, today I was monitoring the indian stock market with Stochastics and Parabolic SAR and was able to catch the moment right after when downtrend changed to uptrend. Today in Indian live stock merket with 5 min chart, I detected how the Parabolic SAR dot changed their position from upperside of candle to lowerside means trend changed from down to up.
my dear friend thank you for your kind comment. You wrote half of the post here 🤝🫡. Best of luck to you.
I have seen this token in the videos of several YouTubers that you are analyzing. Please tell me if actually I can get this token in which exe site or which exchange is listed.
This is not a token. Its a one of the Index in Indian Stock Market called Bank Nifty which represent overall banking sector performance. We cant buy this index and hold long time, but there is option trading available on this index which has lot volatility. To trade Bank Nifty Options , you will need trading account in one of the indian broker platform.
Thank you so much for your information.
X promotion link
https://x.com/mostofajaman55/status/1803454597266284902
Upvoted. Thank You for sending some of your rewards to @null. It will make Steem stronger.
Your post has been successfully curated by our team via @steemdoctor1 at 35%.
Thank you for your committed efforts, we urge you to do more and keep posting high-quality content for a chance to earn valuable upvotes from our team of curators and why not be selected for an additional upvote later this week in our top selection.
thank you so much for support my dear friend @steemdoctor1. 🫂🤝🙋♂️
I really agree, not only in trading matters, it's best when we always think about and apply detailed analysis,
For both beginners and experienced traders, indicators will make it easier for us to analyze the direction of market movements and will reduce the risk of large losses...
Enjoyed reading your publication and wish you success in this contest....
👍
Hello my dear friend Thank you so much for reading my post, I really appreciate your nice comments. both indicator are very important for trading and for us. best of luck.
You are welcome my friend... 👍