Steemit Crypto Academy / S4:W6 / Homework post for @kouba01 || Trading With Chaikin Money Flow Indicator (CMF) by @moohsin
Greetings, Steemians!
I'm fine, and I hope everyone else is as well. This homework post by prof @kouba01 contains a wealth of new trading information. Let's get started with my homework post in this regard.

Question no 1:
In your own words, give a simplified explanation of the CMF indicator with an example of how to calculate its value?
Chaikin Money Flow (CMF) Indicator:
Source: Tradingview.com
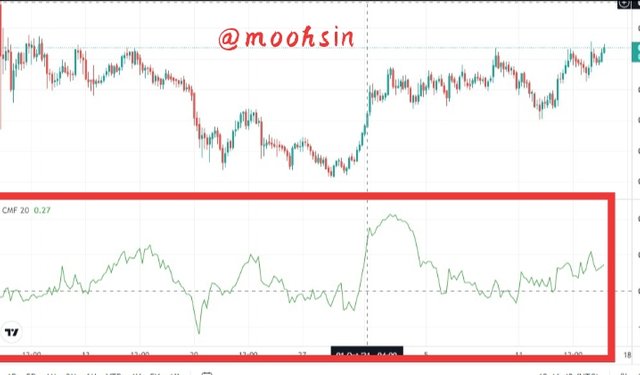
Marc Chaikin created Chaikin Money Flow (CMF), a technical indicator which was created to recognize and identify market trends and strengths. By calculating the volume of cash flow, the CMF essentially illustrates the purchasing and selling pressure in the market. The accumulation and distribution areas of the asset in a certain time period are referred to as volume cash flow. We can have strong buying and selling opportunities by determining the asset's accumulation and distribution levels.
The Chaikin Money Flow (CMF) indicator is an oscillating indicator which shows the market movement and measures the buying and selling pressures on behalf of its oscillation. Chaikin money flow indicator oscillates between the value +1 and -1 having a midpoint value 0.
When the Chaikin money flow (CMF) indicator crosses the midpoint value and move closer to 1, it indicates an increase in volume and buying pressure and when the CMF indicator crosses the midpoint value and moves closer to -1, it indicates rising sellers pressure. The CMF Oscillatory line flows over a specific time period, as suggested by Marc Chaikin, which is 21. It also works on the value of 20 which is set by default.
Calculating Value Of Chaikin Money Flow Indicator:
Here, I will explain the computation of Chaikin Money flow indicator by its formula with the help of an example. The Chaikin money flow formula is divided into three parts;
Monry Flow Multiplier (MFM).
Money Flow Volume (MFV).
Chaikin Money Flow (CMF).
- Money Flow Multiplier:
Money Flow Multiplier (MFM) = [(Close price - Low price) - (High price - Close price)] / (High price - Low price)
- Money Flow Volume:
Money flow volume (MFV) = Money flow multiplier x volume for the period
- Chaikin Money Flow:
Chaikin Money Flow (CMF) = Sum of n periods of Money Flow Volume / sum of n periods of volume
Now Lets suppose the following given values;
High price: $3800
Low price: $3150
Close price: $3600
Volume for the given Period: $6,500
Volume for 21 period: $30,000
For Money flow multiplier (MFM):
Money Flow Multiplier (MFM) = [($3600- $3150) - ( $3800- $3600)] / ($3800-3150)
Money Flow Multiplier (MFM) = 0.384
For Money flow Volume (MFV):
Money flow volume (MFV) = 0.384 * 6500
Money flow volume (MFV) = 2496
Chaikin Money flow (CMF):
Chaikin Money Flow (CMF) = 2496 / 30,000
Chaikin Money Flow (CMF) = 0.083
The value of CMF is 0.083 according to the calculation above derived from the formula.
Question no 2:
Demonstrate how to add the indicator to the chart on a platform other than the tradingview, highlighting how to modify the settings of the period(best setting).(screenshot required)
Adding Chaikin Money Flow Indicator in Charts:
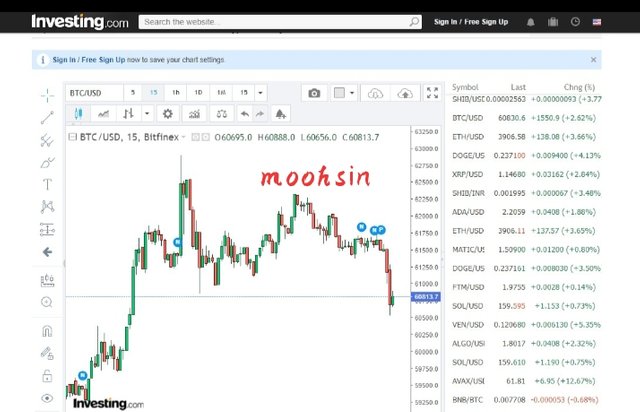
- At first, visit the investing.com website.
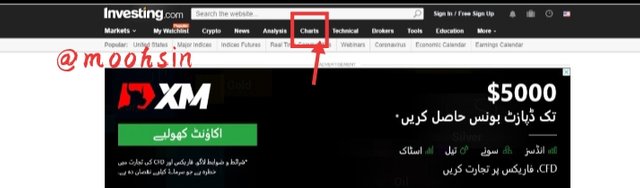
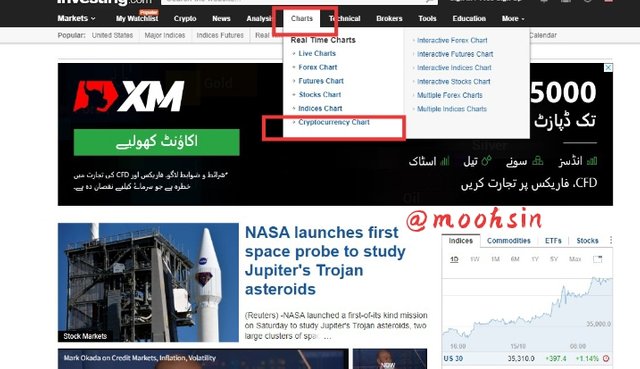
- When you click the chart button, a dropdown menu will appear on the screen; select the cryptocurrency chart button to bring up the charts page on the front screen.
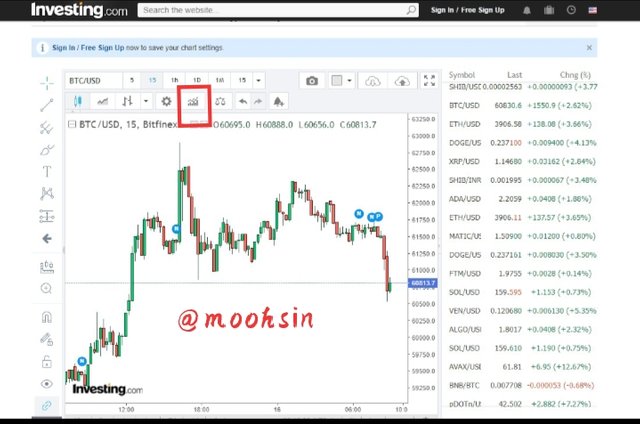
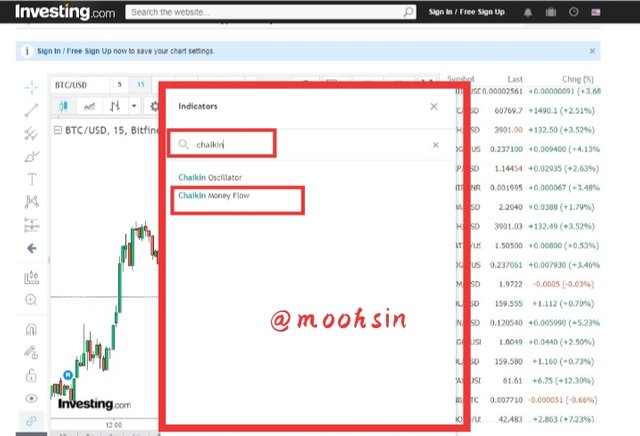
- An indicators button is situated at the top of the chart, pressing the indicator button will bring up an indicator screen. From there, type Chaikin and choose Chaikin Money Flow (CMF) indicator as shown below.
- As indicated in the figure below, the Chaikin Money Flow indicator has been added to your chart. To adjust the setting of the Chaikin money flow indicator, click on the settings button.
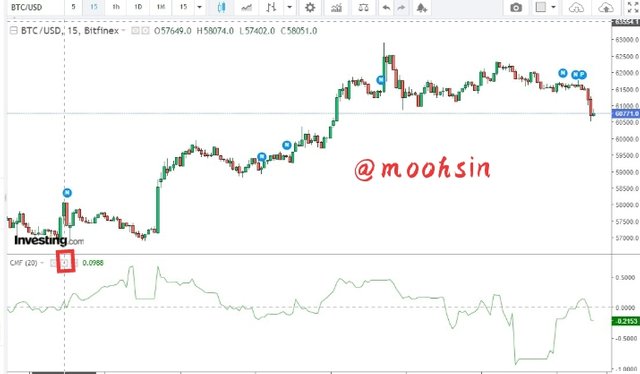
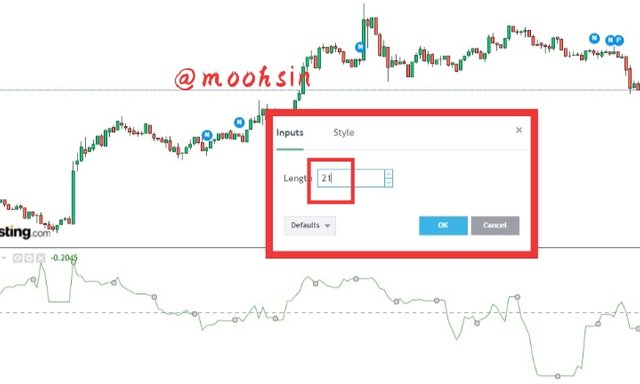
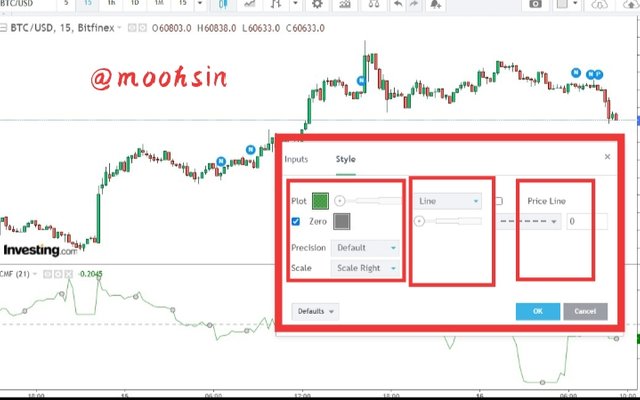
- You can now adjust the setup of the indicator by clicking on the settings of the CMF indicator. The period of the indicator can be changed using the input bar, which is set to 20 by default, you can change the period as you want. From the Style tab, you can also change the colour and styling of the lines. The CMF indicator's period has been set to 21. Below are screenshots of each step of the procedure;
Best Settings of Indicator:
As mentioned above the default setting for the Chaikin Money Flow Indicator is 20, although Marc Chaikin recommends setting it to 21. Choosing the ideal settings is a personal choice for each trader. When you choose a setting in any indication, you're effectively determining how much market situation you're willing to put up with. If you're an short term trader, you'll most likely use low settings because they produce early indications. You could utilize high settings for long-term trading because high settings are sensitive to significant changes in the asset price.
Question no 3:
What is the indicator’s role in confirming the direction of trend and determining entry and exit points (buy/sell)?
Trend Divergence with CMF:
The confirmation of trend direction using this indication is usually based on market pressure, which can come from either buyers or sellers. Trading with the trend is the most profitable and secure method to join the market, while trading against it may be quite risky. As I have said before that this indicator line oscillates between +1 and -1. When the oscillator line goes above the Zero line, the market is in a bullish trend, and when the oscillator line goes below the Zero line, the market is in a bearsih trend.
Entry Point:
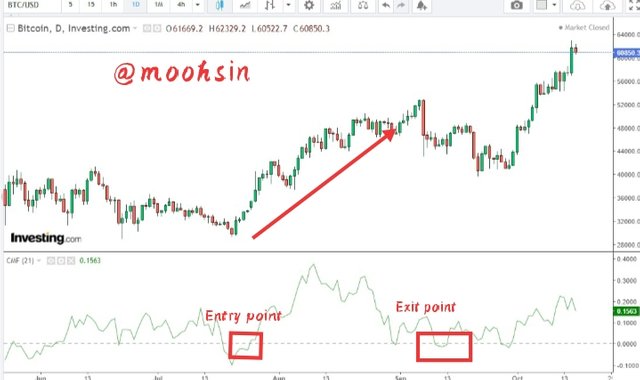
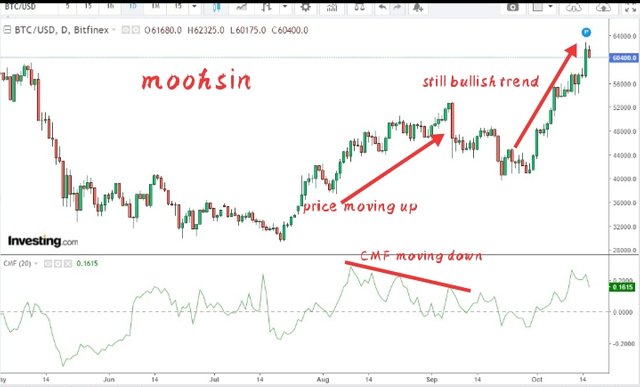
If Chaikin money flow indicator line moves above zero to the positive side (towards +1) with growing volume and price, it supports the upward trend and a buy ebtry can be identified. Money flow can be defined as the inflow of cash into the asset under discussion, which reflects the traders' positive attitude and interest towards the asset.
Investing.com
As shown in the above BTCUSD chart, when the CMF indicator value began to rise, the btc price began to rise as well, showing that an uptrend had been identified and reflecting the market's buying pressure. As a result, we might conclude that this is a great time to buy.
Exit Point:
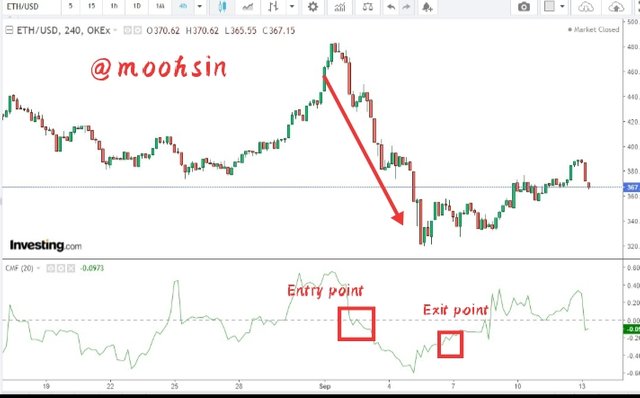
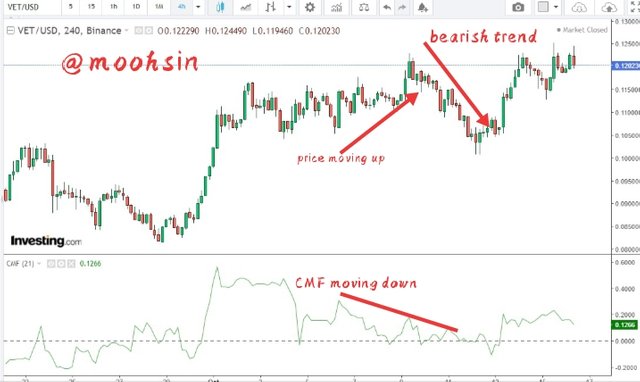
if Chaikin money flow indicator line falls below the zero line as volume rises. It implies a strong bearish trend and a potential sell opportunity. It indicates that money is pouring out of that asset, which reflects traders negative sentiment and less interest in the asset.
Investing.com
As shown in the above ETHUSD, as the CMF indicator value began to decline, the asset price began to fall as well, suggesting that a downtrend had been identified and reflecting the market's selling pressure. As a result, we may conclude that this is a great opportunity to sell.
Question no 4:
Trade with a crossover signal between the CMF and wider lines such as +/- 0.1 or +/- 0.15 or it can also be +/- 0.2, identify the most important signals that can be extracted using several examples. (screenshot required)
Trading with a crossover signal:
Crossover signal between the CMF occurs when the CMF's oscillation line crosses above and below the zero line after every or a few candles, causing traders to become confused and lose money. It is used to prevent fake signals from being generated by the Chaikin money flow (CMF) indicator because, if we look closely at the indicator value, it occasionally crosses the midpoint value up or down, indicating buying and selling points, but it does not really go further bullish or bearish and bounces back to its value, resulting in the trader losing money.
When the CMF line crosses above zero, it indicates that buying pressure is building and a bullish trend is developing. When it climbs up to the +0.1 line, the trend is confirmed. As a result, a buy position can be taken at +0.1, and the trade's subsequent progression will be controlled by establishing a suitable stop loss and take profit level. Exit from the buy trade is verified by a severe down move of CMF near -0.1 on the basis of CMF.
Investing.com
In this case, many people become worried or paniked, and they find themselves at a loss. To deal with this scenario, we use a crossover signal between the CMF and broader lines, such as +/- 0.1 or +/- 0.15, +/- 0.20, or higher.
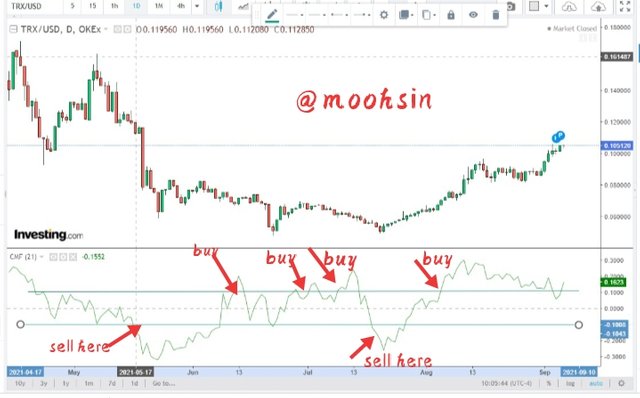
Investing.com
As we can see in the preceding TRXUSD chart the CMF indicator line crosses over the +0.1 level and moves above the 0.1 level, indicating strong buying pressure in the market and hence the possibility of a purchasing trade. The take-profit is set at a 1:1 ratio and the stoploss is placed just above the previous high point. Similarly, the CMF indicator line crosses below -0.1 and continues to move below -0.1, indicating that the market is under selling pressure, and so a sell order can be put. The take-profit is set at a 1:1 ratio and the stoploss is set directly below the previous low point.
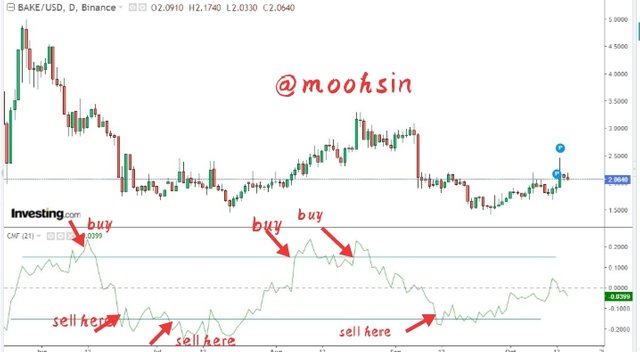
Investing.com
Now if we look at this provided chart above of BAKEUSD, here I have done the analysis of taking trade above or below 0.15 level. If you look closely to the chart when the CMF indicator line crosses over the +0.15 level and moves above the 0.15 level, it indicates strong buying pressure in the market and hence the possibility of a buying trade. The take-profit is set at a 1:1 ratio and the stoploss is placed just above the previous high point. Similarly, the CMF indicator line crosses below -0.15 and continues to move below -0.15, indicating that the market is under selling pressure, and so a sell order can be put. The take-profit is set at a 1:1 ratio and the stoploss is set directly below the previous low point.
Question no 5:
How to trade with divergence between the CMF and the price line? Does this trading strategy produce false signals?(screenshot required)
Trend Divergence and CMF:
Asymmetry of CMF and price behaviour is referred to as divergence. CMF and price movements usually move in the same direction. When the price rises, CMF rises with it, and when the price falls, CMF falls. As a result, we may conclude that CMF and price action are usually in sync. Divergence is the term used to describe when a regular phenomena appears to vary. Trend divergence in CMF indicator happens when both CMF indicator value and price movement move in opposite direction.
Bullish Divergence:
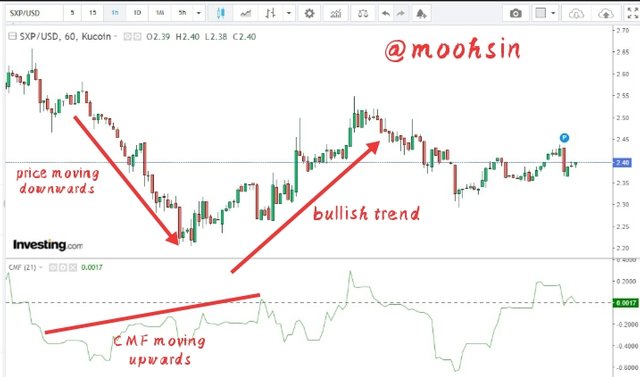
Investing.com
Bullish divergence occurs when the Chaikin Money Flow Indicator began to move upward while the price movement on the charts began to move lower. As you can see in the above figure, this indicates that the downtrend is about to finish, and the price will then move into a bullish trend.
The Chaikin Money Flow Indicator line is heading higher while the price on the chart is moving downward, as shown in the above figure, but the price starts moving upward shortly after which is the confirmation of bullish divergence.
Bearish Divergence:
Investing.com
Bearish divergence occurs when the Chaikin Money Flow Indicator shows a downward movement while the price movement in the charts is upward. As you can see in the above image, the uptrend is going to come to an end, and the price will then go into a bearish trend.
The Chaikin Money Flow Indicator line is heading down as the price on the chart is rising upward, as shown in the above figure, but the price starts moving downward shortly after.
Does CMF Indicator generates False signals:
The Chaikin Money Flow indicator may provide erroneous indications, as we all know that no signal indicator is flawless. A bullish or bearish divergence on the CMF is possible, with price movement continuing in an unexpected direction. Combining the Chaikin Money Flow indicator with additional technical indicators is the greatest way to improve the quality of investment possibilities while also screening out misleading and false signals.
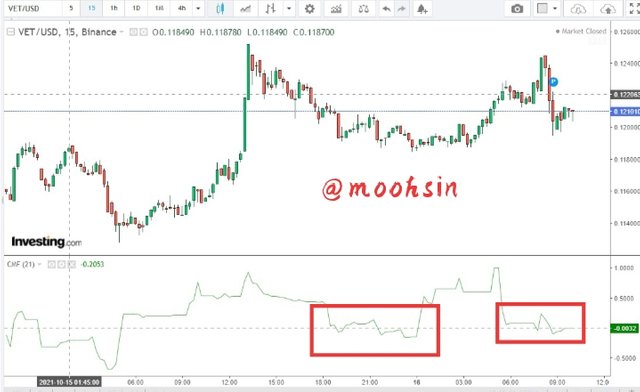
Investing.com
If we put a buy trade too early expecting a positive trend because the asset price is moving down and the value of Chaikin Money Flow (CMF) is rising up, as seen in the above chart image. Furthermore, we can see that the price continues to decline, which is a misleading indication in Divergence trading, and we may end up losing money.
Conclusion:
Chaikin Money Flow (CMF) is a basic indicator that generates signals by taking into account both the price and volume of a asset. By varying around a mean position, it offers signals based on crosses and divergences. It's simple to set up and utilize. This indicator is used by traders to profit from price swings in relation to volume traded over a given time period. It gives us insight into the market's future trends. The CMF indicator makes detecting bullish and bearish divergence simple. When combined with other indicators, it can be a useful tool to understand the market situation and to filter out misleading signals.
Hello @moohsin,
Thank you for participating in the 6th Week Crypto Course in its 4th season and for your efforts to complete the suggested tasks, you deserve a Total|6/10 rating, according to the following scale:
My review :
Work with acceptable content. It was possible to go deeper into the ideas presented and provide several examples. Here are some notes that I bring to you.
You did not well interpet how to choose the appropriate settings for the periods.
You did not go into depth in answering the third question, as you did not explain how to determine the entry and exit points.
Thanks again for your effort, and we look forward to reading your next work.
Sincerely,@kouba01