Crypto Academy Season 4 [ Advanced course ] week 8: Crypto Trading With Rate Of Change (ROC) Indicator by@moohsin
QUESTION NO:1
1 In your own words, give an explanation of the ROC indicator with an example of how to calculate its value?And comment on the result obtained.
Introduction to ROC and its calculation
ROC (Rate of change) indicator basically derived to extract the momentum in market with respect to the measure of price changes of current and base (previous) moments in a cumulative manner distribute them in a percentages. Thus indication of ROC contingent towards price action while making movements above or below at certain point 0 realignment of positive and negative ratios moving above giving positive result while downward giving us negative results.
As this Indicator provides us the range and domain of market with respect to correlating with trend cycle, giving us the divergence in market of overbought & oversold areas might also helps to achieve the bullish and bearish signals by making a positive and negative cross over by respecting the price to make reversals thus this indicator is overall mixture of good technical tool.
Fundamental of ROC
Overbought and oversold position
Overbought and oversold signals are extracted from price movements with high and lows in market. Thus reliability of overbought and oversold can be depicts from the price action where trend might forms and performing highs and lows. Also you can judge by the trough and crust momentums with percentage changes.
Crossovers and reversal:
This indicates the reversal position in market take place where the crossover or inversion might be seen, making a contrary change in price indicates the crossovers in market.
Continuation and divergence:
The continuation or consolidation nodes might seen when the price moves with the sustainable waves like motion making a flat or little bit wavey cycles in market. Although their might the divergence phase also occurs making a perfect turning points in market giving positive or negative divergence.
Thus these were the blueprint of ROC fundamental which should examine overhere to maintain your basics regarding ROC we will cover each of them in detailed with practical approach.
Might it would very contrary of MACD and RSI which also came in to the market where they spot the same fundamental that ROC attempts.
Calculation of ROC
Howbeit calculation is the basic and important part without understanding the means of subject you can't approach the thing by just knowing the news if indicator or by believing on your mentors advice thats good too always acquire fundamental but then do your own research to assure your trade much more which build confidence level.
Here we will interpret the formula which be very similar to unweighted index numbers and averages I familiar with that thus it is very easy and simple to calculate. Lets explore it.
ROC = (current price - previous or base price ago) / previous or base price ago * 100.
Lets assume a example in a simple means;
Suppose a price of current year (2021)is 5000$ by the accumulation of 12 periods, base price(2020) was 1000$ calculate the ROC?
ROC = (950$ - 850$) / 850$* 100 = 11.76 %
Comments
ROC is a positive value and above the zero line which depicts the market is moving upward trend.
Thus you can see the price index of ROC gives us the relative change of 11.86% thus the Indicator assure us the increase of price action with respect to the momentum of percentage changes.
Might this calculation having widespread accumulating the data in accounts to obtained the averages with percentage of momentum, whilst here in ROC the percentage change in price can bee seen.

QUESTION NO:2
2 Demonstrate how to add the indicator to the chart on a platform other than the tradingview, highlighting how to modify the settings of the period(best setting).(screenshot required)
Adding ROC in a chart
I am using binance platform and lets see how can we add ROC indicator to a chart. The pair is btc/busd.
- Click any crypto pair ( BTC/ USDT). Click the indicator.
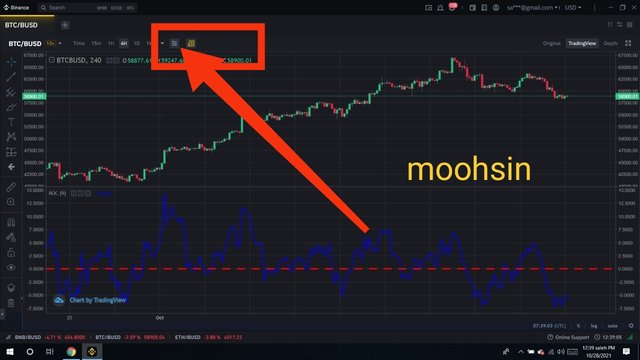
- The bar you can see write ROC there then it will immediately implemented on your screen.
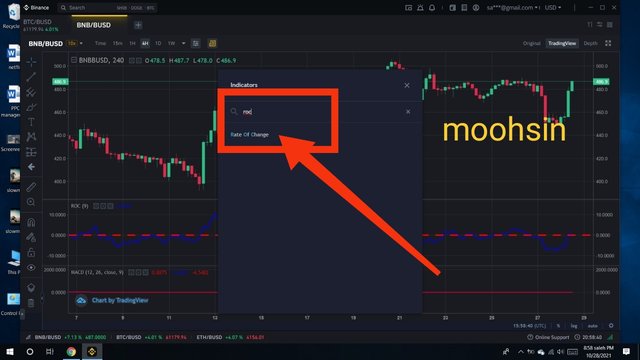
- Here you can see i implemented the ROC indicator through which you can use detect fruitful results.
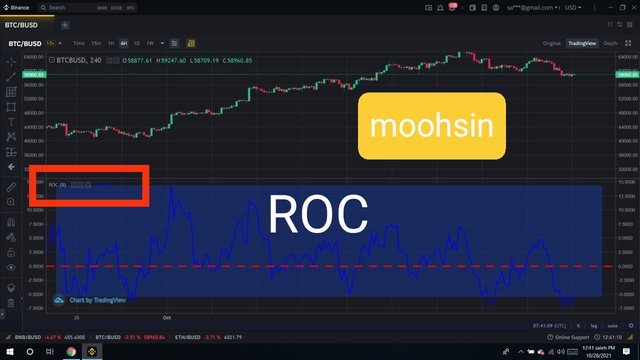
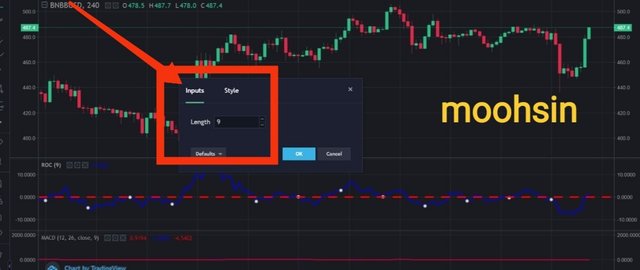
- You can click on input setting and the best setting use as er defaults which is 9
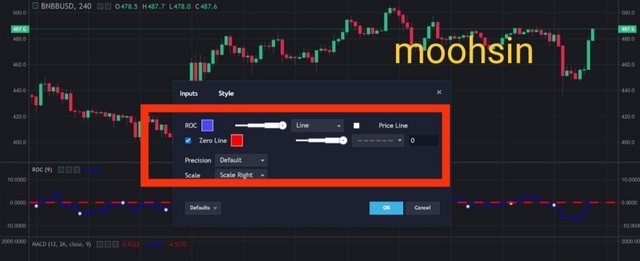
- Here this option can settle the colours and vision of indicator through which i sett dark blue and dotted zero line which is seen below.
QUESTION NO:3
3 What is the ROC trend confirmation strategy? And what are the signals that detect a trend reversal? (Screenshot required)
Trend affirmation areas and trend reversal
The ROC trend confirmation strategy are related with the bullish and bearish cycles in market thus they are respecting the ZERO LINE area thus indcator moving above the zero line depicts the trader that bullish trend might it would be positve forecasting of price action generalized us the downward movement of trend whilst for bearish of price below zero line authenticating us the negativity in market might be observe and generalized us the downward movement of trend and where the trend performs such strategy indicates us the the bullish and bearish trend confirmation areas.
Might it would be better where the trader captures such positon can also sett their sell and buy position with respect to their positon obatined, although here the professional strategy taught always comply your trade with zero line might it wrenches the short term signals too that's why zero line* is more realistic and reliable.
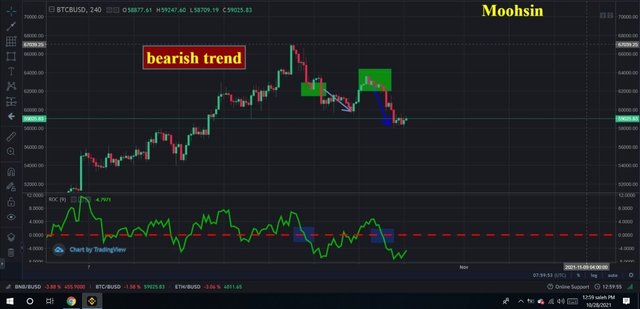
BEARISH Market with ROC (trend):
Here you can see the price falls from $62000 once and again a little upward than perfect bearish zone came from $62000 and this you can also seen in ROC indicator which shows you the break if zero line and bearish zones are enlightened you can see below.
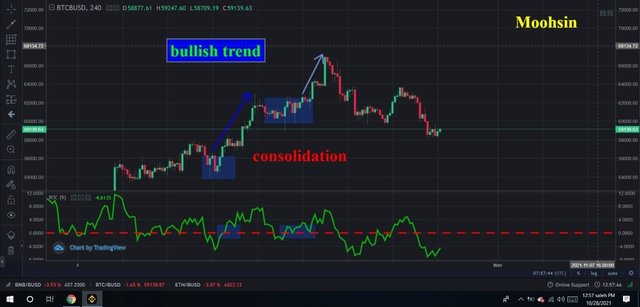
BULLISH Market with ROC(trend):
Here you can see the price increase from $52000 once and again a little upward and makes consolidation then perfect bullish zone came again from $60000 and this you can also seen in ROC indicator which shows you the break of zero line and bullish zones are enlightened you can see below
QUESTION NO:4
4 What is the indicator’s role in determining buy and sell decisions and identifying signals of overbought and oversold؟(screenshot required)
Buy and sell positions
The main means of the indicator which is theist favourite part of traders where to buy and sell, by using ROC this confusion might be reduced becuase ROC measure the centre line technique which is simple to understand that when ROC moves above or below zero line provides the buy and sell opportunity in market. This would take much experience and practice to comply with it.
When ROC is in between zero line and making consolidation thus indicates us there zero trend means ni proper trend in market. Buy signal us observe when ROC cross 0 line and wait until the proper nodes of upward movement arrived while Sell signal when ROC crosses 0 line below and Indicating downward movement in price action.
Always do perform buy or sell trades with multiple indcators through which maximum reliability can be achieved here i just want obatined and clear the concept relating to roc that you can depcits buy ir sell trades in market
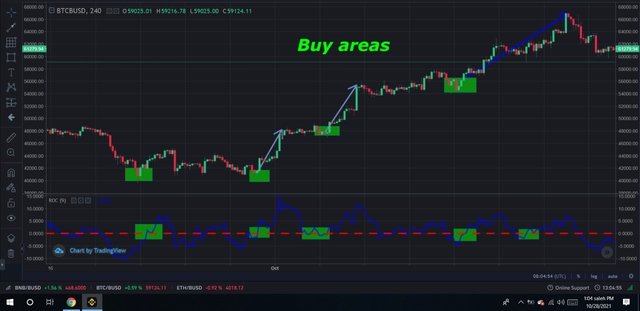
BUY SIGNAL WITH ROC:
The screen shot you can see there are 4trading areas where i enlightened with green boxes showing you the perfect upward trends you need to remember when ever the zero line is crossed wait until perfect Breakout then settles your trade and clear buy position in market are settled. Might little bit lagging also has been shown but the Indicator affirms big confirmation areas in market.
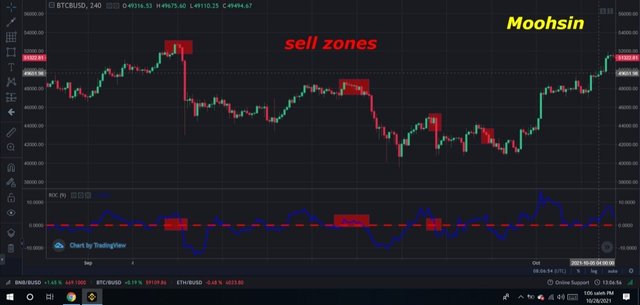
SELL SIGNAL WITH ROC:
Same results can be achieved while contrary of buy you can also extract sell signals. The screen shot you can see there are 4trading areas where i enlightened with green boxes showing you the perfect donward trends you need to remember when ever the zero line is crossed wait until perfect Breakout then settles your trade and clear sell position in market are settled. Might little bit lagging also has been shown but the Indicator affirms big confirmation areas in market.
Overbought and Oversold areas
Overbought position in market where the asset is bought enough and price moves upward enough to chase the extreme level and might a reversal seen in market, contrary oversold position perform same circumstance but downward when price reaches donward extreme levels thus make a reversal also indicating Oversold area.
These areas are important regarding to crypto because they make the trend and trade more reliable we will depcits such extremes in below lets extract them in charts.
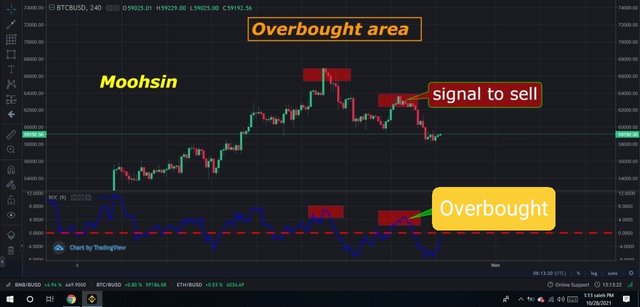
Overbought position:
You all guys are aware of overbought concepts above though here the price of btc at 64000$ is overbought and buyers are active enough to chase the market but ultimately there might be reversal can obtained where we can see clearly at 60000$ the market falls due to this Indicator you can easily and quickly jduge the fundamental of market and its movement by depicting the Overbought area. Another area is at 62000$ again the Downward reversal seems till 59192$ minimum.
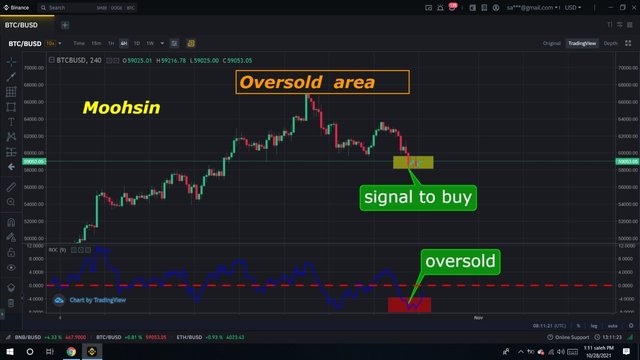
Oversold position:
As above you can see here the contingency oversold area at 59000$ this might become the Oversold area in fee days which was later a reversal of Overbought region through here you can see the Indicator indicating you the oversold area also their is support also maintain by price action and two times price revrsal seems might btc should reversed till 63000$ again if it hits the target than our Indicator show us the positive results.
QUESTION NO:5
5 How to trade with divergence between the ROC and the price line? Does this trading strategy produce false signals?(screenshot required)
Bullish and besrish divergence
These divergence occurs when price of coin nakes new high or low but ROC ain't satusfy the price action and ultimately contrast the new nodes means can't approach the price high or low thus these divergence are easily understand by the bearish bullish areas in market.
ROC having similar strategy just like RSI thats challengin the market opposite where the divergence occurs and thus these divergence formalized them in market and where the traders easily depicst them now lets do some practical approach to illustarte them in a chart.
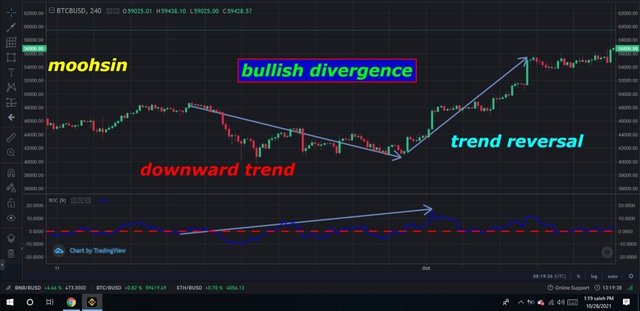
Bullish Divergence With ROC:
These divergence seems to be very important aspect is crypto though they maintain a trend where you can also judge and take benefit by knowing might it would be trend in market if you attempt to obtain bullish divergence it will surely provide you fruitful result you can see below how beautiful the ROC indicator moves with price action and ultimately make trend and move upward there might be a good opportunity cam be extract for trades which i enlightened below.
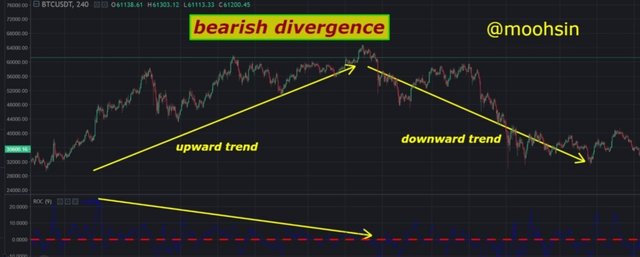
Bearish divergence with ROC:
Same here if you attempt to obtain bearish divergence it will surely provide you fruitful result you can see below how beautiful the ROC indicator moves with price action and ultimately make trend and move downward trend there might be a good opportunity cam be extract for trades which i enlightened below. The besrish nodes can be important to make relieve from market by knowing perfect zones which you can see.
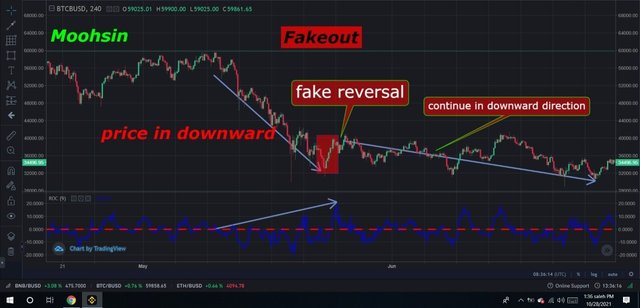
Fake outs
Yes fakeouts are the common standard error in crypto currency Indicators, these fakouts can easily liquidate the trader and for future trading you should be very confident towards your trades because they can easily liquidate you by making false signals in market and mostly traders got fails when they buy or sell the coin always wait and let the indicator may came in proper structure through which you can make ascertain trades that won't liquidate you easily.
These signals only might came and reversed or might they follow the divergence rule ROC in other state and price in other ultimately liquidate the trend and they also sometimes follow the divergence rule and follow them for consolidated period then again interact with Indicator.
The chart below show us the fake out in market for short term which i illustrated above then meanwhile enlogate movement and comply with Indicator again. So you are dreaming for profit by acquiring your position in market but ultimately you got liquidate because you ain't use multiple Indicator though it's very important to use other indicators to reduced risk. The Chart clearly shows such illustrations you can see below.
QUESTION NO:6
6 How to Identify and Confirm Breakouts using ROC indicator?(screenshot required)
Breakouts with support and resistance
The breakouts might seen when price moves above or below the resistance or support levels though here we will emerge ROC with resistance and support from our bearish and bullish zones the potential if Breakouts might be extracted easily.
Things to remember;
The price breaks the resistance levels with strong hits
Multiple hit of price towards resistance.
Manipulate the ROC Indicator while it is in the mood to respect the price action if yes positve or negative breakout cam bee observes.
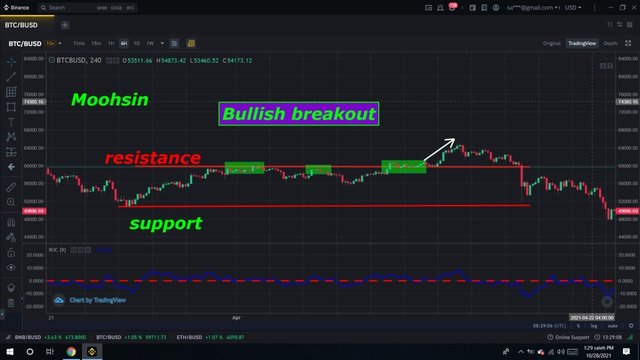
bullish breakout:
Always remember the points i wrote above that thhe price breaks the Resistance levels with strong hits then ROC movement matters alot because its your mean Indicator wait for clear cross then you can judge where you are trading might be positive results can bee seen just i enlightened in below chart.
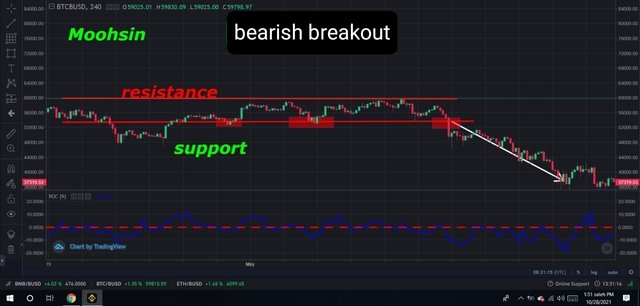
bearish breakout:
Always remember the points i wrote above that thhe price breaks the Support levels with strong hits then ROC movement matters alot because its your mean Indicator wait for clear cross then you can judge where you are trading might be positive results can bee seen just i enlightened in below chart.
QUESTION NO:7
7 Review the chart of any crypto pair and present the various signals giving by ROC trading strategy. (Screenshot required)
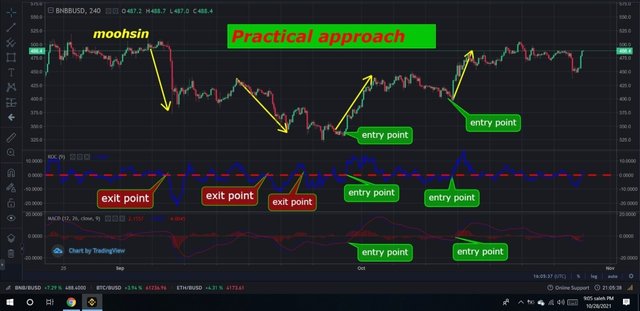
Practical approach
Here i would implies one tool and one strategy with ROC Indicator which can prevent fake and encourages true picture in narket for trading. I am using resistance and support strategy and applying MACD for visualising prominent trades in market.
As far the indicator itself little bit lagging because crpto assets quickly shapes the market with completly different structures though these Indicators cam overcome your risk so using different Indicator can ultimately encourage your trade with confidencial manner.
Trading with ROC MACD (Using support and resistance)
Conclusion:
The indicator ROC is also a good Indicator ro depicts good signals in market however our mentor @kouba01 mentioned that we need more practice in Overbought and Oversold areas so all what i understand delivers in my best manner there was some lagging because experience matters. This indicator is new for me and very similar to rsi so i will surely engaged to enhance my trade with ROC also.
As per my understanding the divergence are the most
Difficult thing to understand because these divergence can be very useful if you captures them at right time right place.
Overall review regarding ROC is that it is very finest and good indicator with simple strategies using it with different indcators can maintain and increase the reliability of your trade.
So this lecture also provides us one more trading tool to depict and outline positive trades in market thanks professor @kouba01 for this knowledgeable lecutre.
Regards;
@moohsin
Hi @moohsin
Thanks for participating in the Steemit Crypto Academy
Feedback
Total| 4/10
This is under-average content. You need to improve on the clarity of your explanations. You gambled a lot in your work. I literally found trouble in understanding what you were explaining.
There were many typing errors in your work. Always check your work to rectify such errors before submitting it for review. Your article lacked an in-depth analysis into information regarding trading using the Rate of Change indicator.
Lastly, Do Not use the #club5050 tag on your articles if you have not done any power up in the last 7days.
Hy @yohan2on
Professor the post took several days and you ain't rated enough, if it is average sort of working and from your mean there are lots of mistake please highlight for me what mistake i had done. From question 1 to question 7 i maintained and rechecked each and every thing but because of little bit typing mistake you didn't rated me i had done errors not a blender. Please review my post and let me know what falseness i had done.
QUESTION:1 Introduction is defined with Calculation are attempted.
QUESTION:2 I clearly expressed the ROC adding procedure with well defined charts.
QUESTION:3 Trend confirmation are captured with practical chart explanation.
QUESTION:4 Buy and sell areas are enlightened with clear overbought and oversold areas.
QUESTION:5 Divergence are defined as professor taught us and practical approach is attempted. Also fakeouts are defined briefly.
QUESTION:6 In this question i explained Breakout strategy but also shows my strategy which i used in bullish and bearish market with support and resistance.
QUESTION:7 A practical approach with different technical tools is explained.
Professor the post took me several hours and i also edited charts with great zeal please don't neglect my work because of little errors. Hope you won't let my working ruined.
professor @kouba01 i always take active participation in your post and always scored maximum rating but I honestly try my best and you know very well how difficult is to approach technical indicators posts, you can see i maintain the charts with clear view and also checked them from your post please review my post again.