Introduction to the Principles of Crypto Analysis - Crypto Academy S4W7 - Homework Post for @imagen
.jpg)
Hello, everyone.
Another week has passed at the Crypto Academy. This essay was created in response to Professor @imagen's assignment. He presented Introduction to Cryptographic Principles and went into further depth on the subject. So, in the following paragraphs, I'll address each question one by one.

QUESTION1: What is the difference between Fundamental Analysis and Technical Analysis? Which one is used most often?
Fundamental analysis and Technical analysis are not methods that are restricted to investing in assets. They are used by lots of different types of traders as well. So, crypto traders, Forex traders all use fundamental analysis or technical analysis or maybe a combination of the two in different ways.
Difference between fundamental and technical analysis
FUNDAMENTAL ANALYSIS:
Traders and investors employ fundamental analysis to evaluate the inherent worth of assets or any firm in general. It is yet another extensively used method for determining the value of cryptocurrencies.
This research looks at both internal and external aspects to see if an asset or business is worth investing in. the main purpose of the analysis is to know what coins to trade so that we wouldn't make losses.
To have a good study and to be able to receive the proper information or result as to whether the asset is overvalued/overpriced or depreciated, there are three crucial criteria to consider. Fundamental Project analysis, metric analysis, and on-chain analysis are the three items. If a thorough fundamental analysis is to be completed, these three analyses must be finalized.
The fundamental metrics are calculated by examining the project's current market capitalization, liquidity, current supply, circulating, and maximum supply in order to gain insight into how people are using the project, the remaining supply that the project is likely to supply in the future, and so on. Finally, on-chain metrics are calculated by looking at previous activity on the project's blockchain, such as transactions, hash rate, asset staking volume, number of addresses or wallets established, and so on.
TECHNICAL ANALYSIS:
Technical Analysis is primarily used to identify the next trend as early as possible. This gives the trader the opportunity to “ride the trend” and take advantage of the potential rally. Traders have a lot of tools to help them in the quest to find the trend.
For example, employing popular price patterns such as the Head and Shoulders can assist in identifying trends at their earliest stages. Trendlines guide traders to navigate the financial markets like the compass guides the sailor to navigate the open seas. If the price honors the trendline, the prevailing trend remains intact. If the trendline is “violated” this is seen as a warning that the prevailing trend may be coming to an end. Indicators and oscillators are also very popular tools for technical traders, and the MACD is among the most used. When the MACD crosses above the zero line, it signals an uptrend. When it falls below the zero-line it signals the beginning of a downward movement. Traders are advised to combine a variety of tools, rather than taking the much riskier option of relying on a single one.
Another way for analyzing the price of a crypto asset is technical analysis. This strategy is also known as chartism since it primarily involves the use of a chart to examine the price trend of an item. Technical analysis is the study of previous price behavior in order to discover and forecast price direction in the future. Traders employ a variety of technical analysis methods to forecast price movement. Chart and candlestick patterns, Fibonacci retracement tool, technical indicators, and so on are some of these instruments. These tools are used on the chart to analyze price history in order to predict when a trend will stop or continue so that you may profit from joining it.
In conclusion, Fundamental analysis may be defined as the process of determining the cryptocurrency's long-term value. Technical analysis, on the other hand, relied solely on short-term data. As a result, technical analysis is mostly employed in short-term trading. People employ both ways of analysis. Fundamental analysis, on the other hand, is mostly applied in cryptocurrencies, in my opinion. People favor fundamental analysis over technical analysis because technical analysis requires a lot of talent and the volatility of cryptocurrencies might cause one to lose all of their money if they don't know how to utilize technical analysis tools properly.
QUESTION:2 Choose one of the following crypto assets and perform a Fundamental Analysis indicating the objective of the Project, Financial Metrics, and On-Chain Metrics .
I'm going to go with CARDANO(ADA) for this job. This asset's fundamental analysis will be explained and performed by me.
CARDANO(ADA):
Project Analysis:
Cardano is a third-generation blockchain platform that is well-known. Charles Hoskinson first proposed this in 2017. The Ethereum blockchain was co-founded by Charles Hoskinson. Cardano(ADA) uses the Proof of Stake consensus process, which makes it a safe and speedy blockchain.
The Cardano is used to conduct smart contracts, which adds to the coin's appeal. The goal of this project was to create a decentralized platform without the use of a middleman. The blockchain eliminates the need for a central authority to conduct transactions, making the financial system more safe and efficient. The ETH blockchain is regarded to be a more sophisticated version. It provides a decentralized linked system with tremendous scalability.
The most prevalent and essential use case of this project is the tracking and identification system. This eco-friendly project is also energy efficient since it uses less energy to mine transactions. The blockchain was improved in 2020 in order to make it more decentralized and safe.
Financial Metrics of Cardano:
According to coinmarketcap the price of 1ADA as at the time of writing this task is $2.16. The screenshot is displayed below:
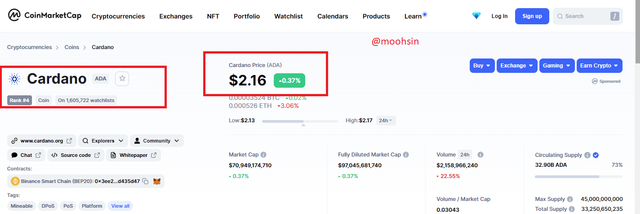
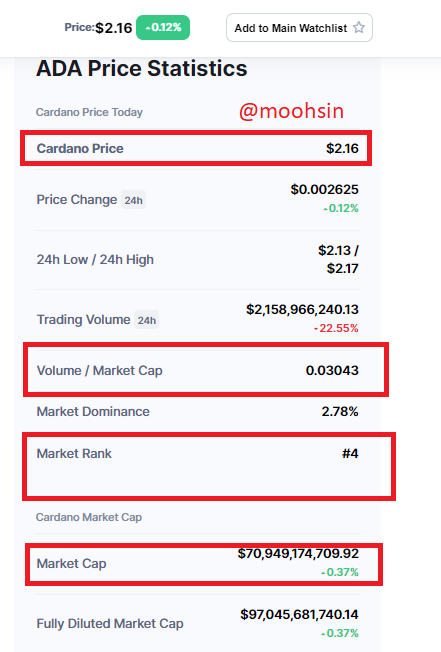
The current Market Capitalization of ADA is $70,949,174,709.92 as indicated in the screenshot below. The market dominance of this token is 2.78% as indicated in the screenshot below. The token is ranked 4th in coinmarketcap and has a trading volume of $2,158,966,240.13 which shows that the ADA token is trading with great high liquidity.
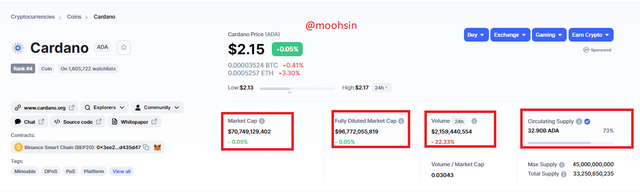
The Circulating supply of ADA as of the time of writing this task is 32.90B ADA and the total supply of ADA is 33,250,650,235 as indicated respectively in the screenshot below. Circulating supply is the total number of coins that are in the hands of the user and in the market.
As seen in the screenshot below, the Maximum supply of ADA written above total supply has 45,000,000,000 which is higher than any other altcoin. This means that the circulating supply will continue to grow more as time flies. The inflation growth of ADA is set to 2.05% every year. This, therefore, means ADA is a good project to invest in.
On-Chain Metrics of ADA:
I will be using Cardano's scan website Source to show some activities that have been recorded on the ADA platform in the past.
I simply searched for Cardano scan chain metic and I saw the link given above.
Below is the home page of this website:
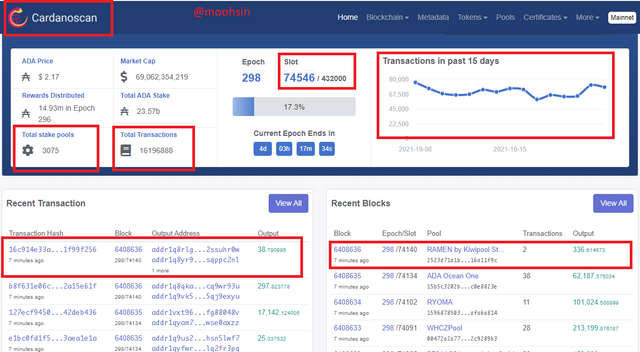
When I visited the cardano scan website, I got the following information.
The total number of transactions = 16196888
Market Capitalization = 69,062,354,219$
ADA price = 2.17$
Total ADA staked = 23.57b
Total Stake pool = 3075
The screenshot above also shows the total number of blocks that have formed. At the time of taking the screenshot, the total number of blocks that have formed is 6408636 as indicated in the screenshot above. on the left-hand side of the block it shows the hash of that block and on clicking on that it shows the below screenshot:
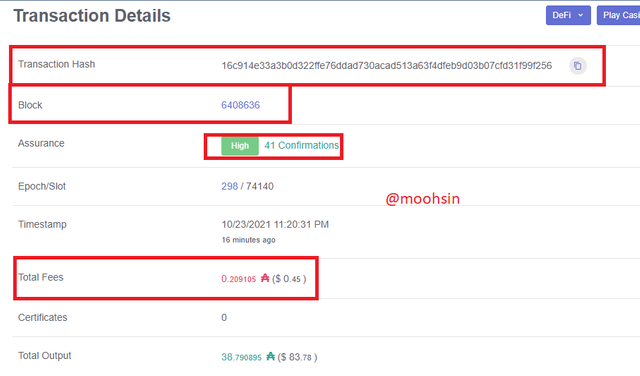
It shows the total fees charged of the transaction and the level of assurance that the transaction has been successfully completed with 41 confirmations.
QUESTION:3 Make a purchase from your verified account of at least 10 USD of the currency selected in the previous point. Describe the process. (Show Screenshots)
Before purchasing a coin, it is necessary to conduct a thorough market analysis. When the coin is in a decline and the market is low, this is the greatest time to buy. Because the price is cheap at the moment, and investors gain from joining at a low price. I used the William % R indicator to evaluate the market. The market appears to be on a downward trend. Because the William % R reading is less than 70, I'm going to make a buy using my Binance account.
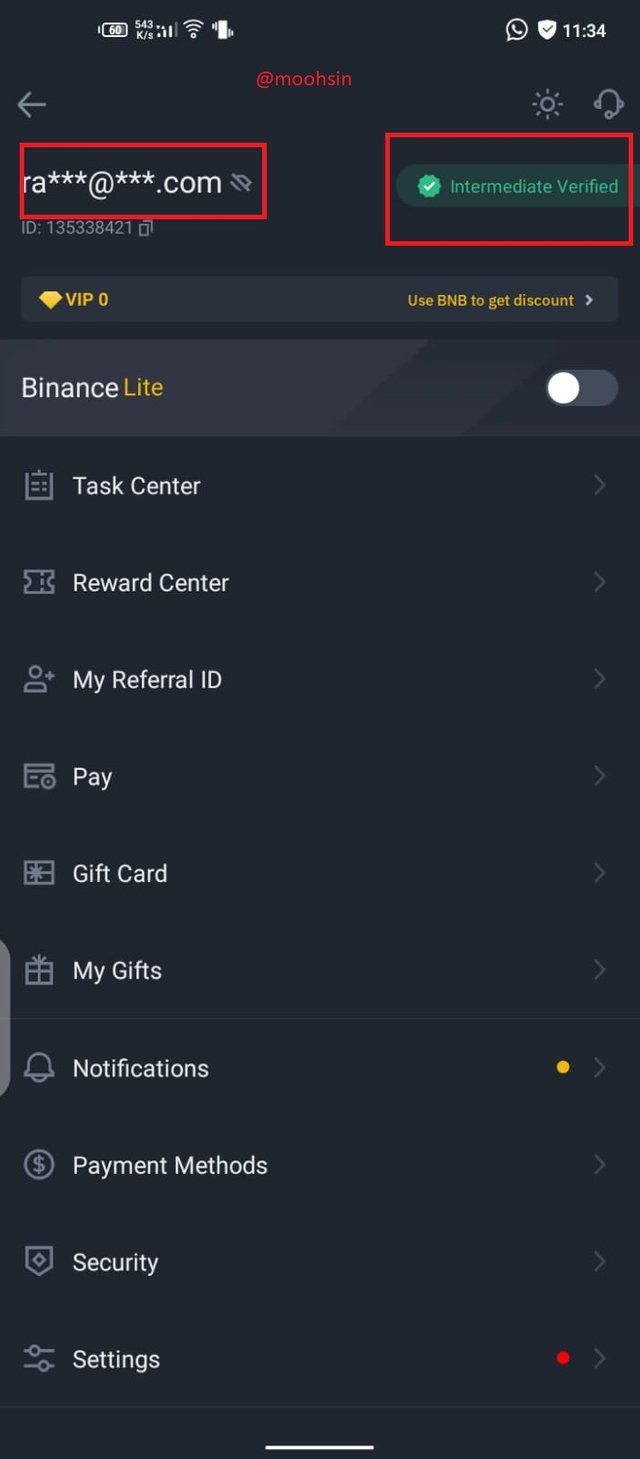
- Below is the picture of my verified account of Binance(From my mobile phone):
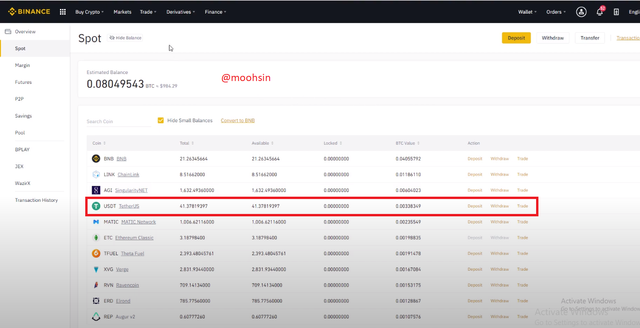
- After that you can see below the picture of my wallet and the amount of USDT which is 41.37 with no ADA coin in it:
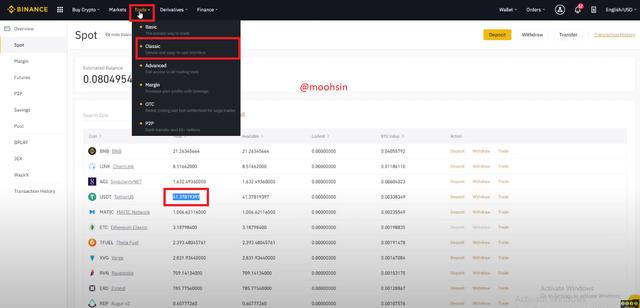
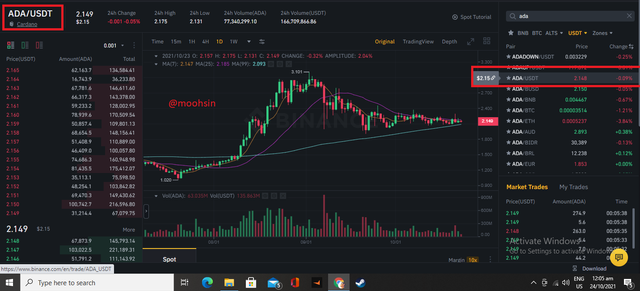
- After that, I go to the tab of trade and in the sub-tab of Classic where I will be going to buy ADA coin with the pair of ADA/USDT:
In the picture below,I selected the pair ADA/USDT with the price of 2.15$:
After selecting the pair I entered the amount of USDT that I want to transact in order to buy ADA coins which were ultimately going me 4.6 ADA coins:
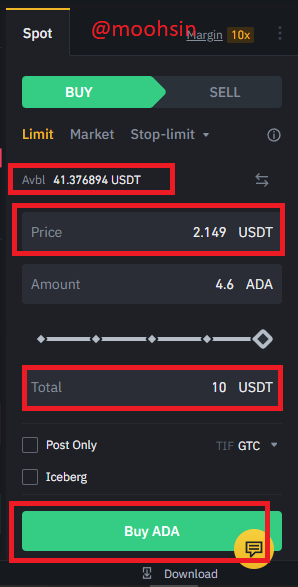
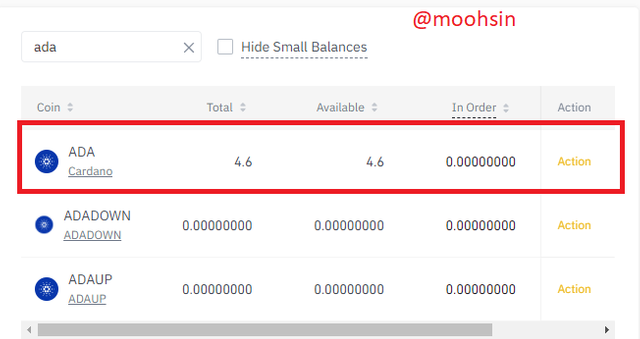
- I pressed the buy ADA button and it delivered me 4.6 ADA as you can see in the below screenshot:
4.) Apply Fibonacci retracements to the previously selected asset with a 4 hour time frame on the platform of your choice. Observe the evolution of the price at 24 and 48 hours, did it go up or down in value? Look to identify resistance and support levels. (Show Screenshots at 0, 24 and 48 hours of purchase where the date and time are observed)
In this section of the inquiry, I'll use Fibonacci retracement to analyze the ADA/USDT chart. To put this into practice, I'll utilize the trading view. The website may be accessed by clicking here. Then, once it's loaded to the homepage, click on the chart on the left-hand side of the page, and it'll load for you. There is four-level which are 23.6%, 38.2%, 50%, and 61.8% which is to believed as golden ratios:
At 0 Hour:
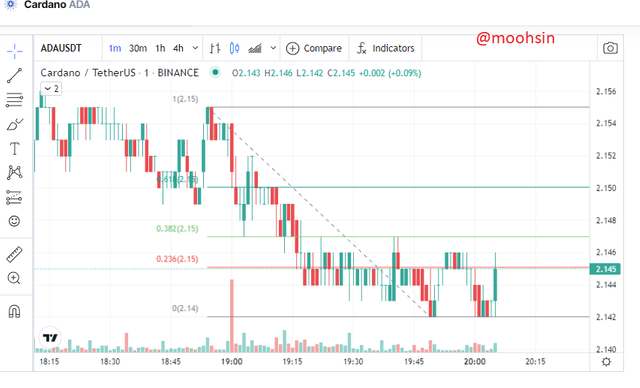
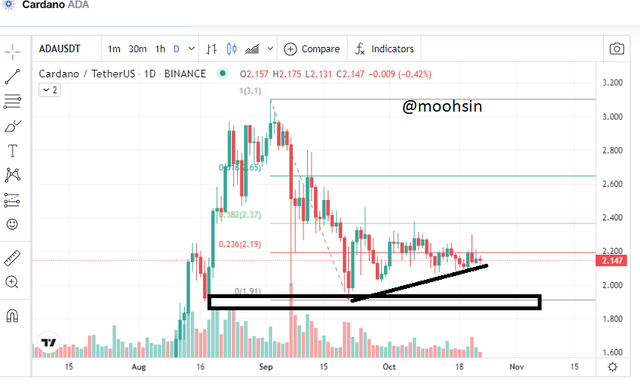
I have set the time frame to 0 hours and then applied the Fibonacci retracement to the chart in the accompanying screenshot. The market appears to be heading upward. In the market, there is a positive tendency. When the coin reached 2.145$, I purchased it. There was some price fluctuation with higher highs and lower lows. We know that anytime there is an advance in the market, the support levels are 23.6 %, 38.2 %, and 61.8 % based on the Fibonacci retracement.
At 24th Hour:
The time limit has been set to 24 hours. The market is on an upswing, as seen by the screen briefly. Because the market is now at a high level, I decided to buy when the price was 2.147$. We know that anytime there is an advance in the market, the support levels are 23.6 percent, 38.2 percent, and 61.8 percent based on the Fibonacci retracement.
At 48th Hour:
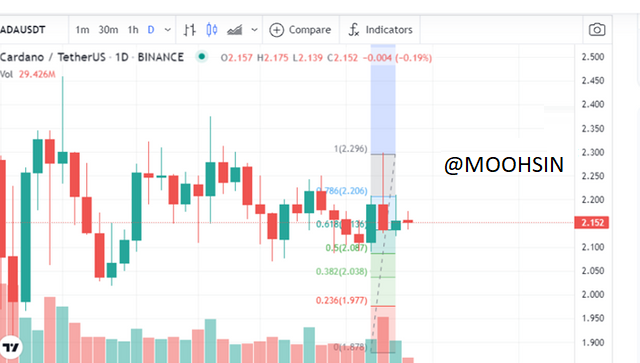
The time limit has been set to 48 hours. The market is on an upswing, as seen by the screen briefly. Because the market is now at a high level, I decided to buy when the price was 2.110$. We know that anytime there is an advance in the market, the support levels are 23.6 percent, 38.2 percent, and 61.8 percent based on the Fibonacci retracement.
QUESTION:5 What are Bollinger Bands? How do they apply to Crypto Technical Analysis? With which other tool or indicator do you combine Bollinger Bands to analyze a Crypto? Justify your answer.)
In this section of the work, I'll describe Bollinger bands, how they connect to crypto technical analysis and some of the indicators that may be used in conjunction with them to get useful results.
Bollinger bands are a technical indicator that traders use to forecast market movement. It is considered to be a trend indicator. John Bollinger, a well-known analyst, created the indicator. The indicator indicates how noisy or quiet the market is.
Three lines are plotted on the main chart to make up the indication. The limes are divided into bands, with the bottom band, middle band, and upper band being the most common. The lower band depicts the asset's average price at a given point in time. The center band is roughly two standard deviations distant from the upper and lower bands. The term "mean price" is frequently used to describe them.
The Bollinger bands are calculated using period and standard deviation. The default period is 20 days, and the standard deviation is 2. These two variables can be changed. It may also be used to assess how high or low an asset's price is at a certain point in time.
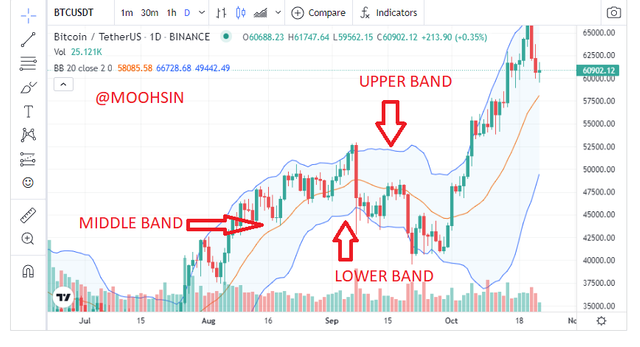
On the BTCUSD chart, the Bollinger band can be seen in the picture above. Moving average refers to the area in the center. Red arrows represent the top and lower bands in the screenshot.
The bands are narrowed when the market is in a low volatility period, which might predict a major price move in the future. However, when the bands appear to be wide apart, it indicates that the market is volatile. Traders frequently employ the band as an entrance and exit point. For example, if the price crosses the middle band higher, the upper band will be utilized as the profit objective for any trades taken from the middle band. Bollinger bands can also be used to determine the trend. When the price of an asset hangs on the band envelope for an extended length of time, for example, it indicates that the asset's trend is continuing.
Combination of Stochastic Oscillator with Bollinger Band:
The Bollinger indicator alone might lead to an erroneous outcome. As a result, it's always a good idea to pair the Bollinger indication with another indicator. When we combine it with another indication, the result's accuracy and dependability improve. I've utilized the Bollinger indicator with the Stochastic Oscillator.
The stochastic oscillator is a momentum indicator that may assist traders spot an asset's trend as well as potential points of a trend reversal. It consists of two lines that move in lockstep with the price. The % Kline and % D line are the two lines of a stochastic oscillator. The stochastic overbought and oversold regions are also worth noting. When the stochastic lines are between 80 and 100, an asset is considered to be overbought, and when they are between 20 and 0, it is said to be oversold.
The current trend is assumed to be ending when the percent K line crosses the percent D line at the overbought area, and a sell order is always considered. When this occurs in the oversold region, however, the situation is reversed. This location is continuously anticipating a purchase order.
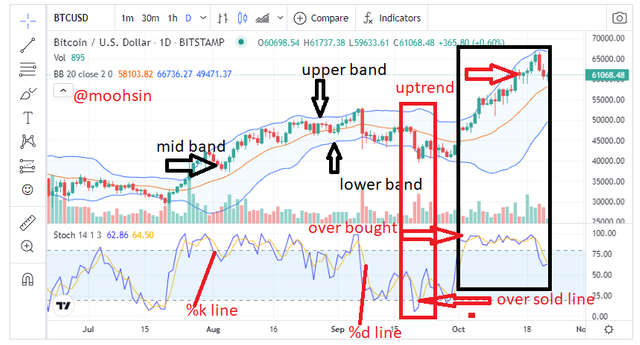
On the BTC/USD chart, the stochastic oscillator and Bollinger band oscillator can be seen. The Bollinger band is depicted on the chart and moves independently of the candlesticks. The stochastic oscillator is located to the right. In the snapshot, the overbought and oversold regions are highlighted. The percent K and D lines are also shown above.
Traders usually search for sell orders when the price bounces at the higher Bollinger band, and they always use the middle band as a goal, but when the price bounces at the lower band, they always look for purchase orders.
When the stochastic indicator is in the oversold zone and the Bollinger bands show price moving downward toward the lower band, it is time to quit the market. If one indicator generates false signals, the second indicator can assist investors in detecting the false signals and preventing them from making poor trading selections.
CONCLUSION:
In cryptocurrency trading, fundamental and technical analysis are two types of analysis. Fundamental analysis is concerned with the application of project, metric, and on-chain analysis to evaluate an asset's inherent value, or worth. Technical analysis is the study of previous price behavior or history using technical tools on a price chart in an attempt to predict price direction in the future.
Technical analysis necessitates that traders be proficient in the use of technical instruments that will be applied to the chart in order to do a thorough examination. The majority of fundamental analysis is concerned with facts or information. The information that is accessible will be utilized solely for asset analysis. Combining the two types of analysis will offer a trader an advantage and result in more accurate analysis. In technical analysis, more instruments are accessible to study, such as technical indicators and Fibonacci retracement, patterns, and so on. These tools can assist traders in doing thorough analyses. They're much better when you combine them since they'll act as a confluence. It is important to note that while there are thousands of cryptocurrencies available, traders must learn how to assess and combine tools in order to benefit from them, whether in the short or long term. Failure to do so and learn will always result in a loss of cryptocurrency funds.
I completed a basic study of ADA for this homework, and I was able to make the investment Professor requested using my verified account. Professor @imagen, thank you for a fantastic lesson. It made a significant difference in my Knowledge.
Gracias por participar en la Cuarta Temporada de la Steemit Crypto Academy.
Continua esforzandote, espero seguir corrigiendo tus asignaciones.