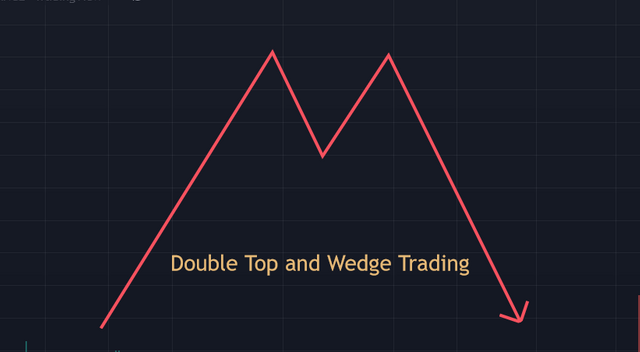
Double Top and Wedge Trading - Crypto Academy S6W2 - Homework Post for @imagen
Good day everyone, sometimes it looks really impressive to see the way time fly and how there is really nothing you can do about that unless you would utilize it properly. It is good to be a part of the week two of this season, and without any further delay, I will immediately go into the day's assignment from @imagen

Explain in your own words the concept of Double Top, Double Bottom and Wedges. How to interpret each one?
Trading, like I always say is a game of rules, psychology and money management. Traders respect the chart patterns and the rules that come with the and this has become a culture in trading, unless of course it fails. A few trading chart pattern that I will be looking at in this post is the Double Top, Double Bottom and wedge.
Double Top
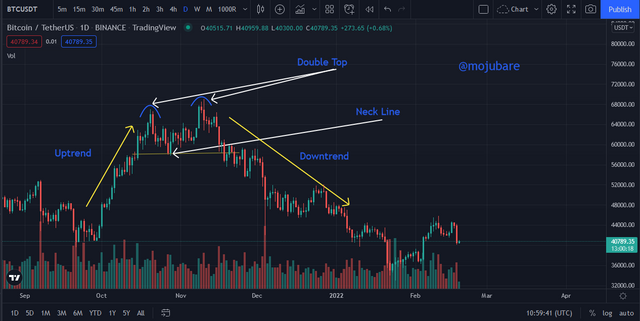
Double Top pattern is a reversal pattern that occurs when price fails to make a new higher high after reaching a significant high previously. A double top usually signals the end of a Bullish run or for a retracement. The price move upwards and peaks, then the price reverses to form a valley not deeper than 20% of the uptrend and then touches the peak again but do not break through the peak. The two peaks are to appear close to the same price or at the same price. The price action after the second top should close below the valley to confirm the pattern. The volume spikes at the peak of the second top creating a confirmation for the chart.
Peaks can be regarded as either Adam or Eve. Adam peaks are narrow peaks and can be made up of either one or two candlesticks, Eve peaks are wide peaks comprising numerous spikes which can be shorter compared to the Adam peak. With the Double top, there can be four variations, Adam & Adam double top, Adam & Eve double Top, Eve and Eve double Top, and Eve & Adam double Top.
Double Bottom
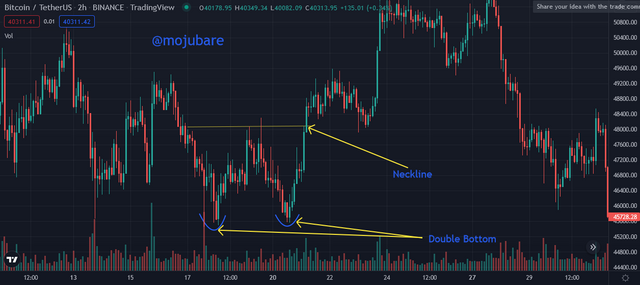
Just like the Double top, double bottom is also a reversal pattern that occurs as a result of a downtrend lower low which then reverses, after which the price tries to test the region but fails to break through the support down peak which leads to a reversal uptrend.
The price trends downwards to reach a lower low, then the price reverses upwards about 20% of the downtrend then the price starts to valley downwards again reaching the previous low or around the lower low but not breaking the lower low. Each valley of the downtrend must be similar and the volume increases with the reversal when breaking the neckline of the pattern. When the price breaks the neckline and heads upwards, then the pattern is confirmed.
Wedge
Wedge is similar to a symmetrical triangle the with two lines, converging at Apex of the formation towards the right. The difference between a Wedge and a symmetrical triangle is the fact that a wedge has a slant edge showing its direction, which is the reason why there are two types of wedges, falling wedge, and rising wedge. Wedge unlike the double top and bottom is a continuous chart pattern. The wedge slants against the current trend.
Falling Wedge
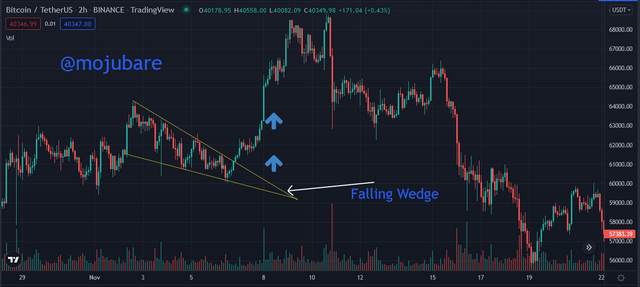
As i said before that a wedge is a continuous pattern, so it is found within an existing trend While a Wedge can appear at the top or bottom of a chart, a falling wedge appears at the near top of a price chart, as the price starts to reject the highest high thereby forming smaller lower highs. At this point, the volume is reduced during the formation. The wedge occurs in the middle of a previous uptrend, the price sees a little pullback as a result of reduced pressure and volume. The formation is formed with the volume reduced, at the breakout, the volume increases and the price continues in an uptrend.
Rising Wedge
A rising wedge is a formation as a result of an upward spiral movement of price which is drawn by two lines intercepting in an upward slope trend line. The two lines are drawn along the minor highs and lows sloping upwards, the upward movement would be very visible that it is a minor movement. The price would break downwards in a continuation of its previous trend. During the formation, the volume is reduced and during breakout of the formation the volume increases and price head downwards.
Main differences between the Double Top and the Double Bottom. Show screenshots
- It is a reversal chart pattern interpreting a downtrend
- It shows a M shape
- It appears at the top of a price chart after an uptrend, and it is followed by a downtrend.
- It forms a W shape at the end of a downtrend
- it Depicts a reversal trend upwards after formation
- It is formed at the support region of a downtrend.
Explain and highlight the main differences between a bullish wedge and a bearish wedge. Show screenshots of each.
A bullish wedge is also referred to as a falling wedge. The price experience a little setback in trend after a previous uptrend. The falling wedge occurs when there is a minor downtrend in a previous uptrend, and after the price breaks out from the falling wedge pattern, the uptrend continues
A bearish wedge is known as a rising wedge. Contrary to its name, the price does not rise after the formation, instead, the price falls. The Bearish Wedge occurs when two lines are drawn trough minor reverses in a downtrend creating the wedge shape after which the price breaks out of the pattern and the price continues downwards.
Explain the volatility that usually exists with respect to the volume in the wedges. When is there usually more volume? What happens if a pullback breaks the support of a wedge?
When a wedge (rising and falling)is being formed, the volume reduces, and the price becomes less volatile. Either in a rising wedge or falling wedge, in either case, volume reduces throughout the formation, and there are multiple touches of the two wedge lines, until there is a breakout. If there is a break in the support of the wedge, then a continuation of the previous trend is expected.
Find and analyze the double top pattern on at least 2 charts. Show your own screenshots.
I will be analysing double top patterns on crypto pairs ETH/USDT, ADA/USDT.
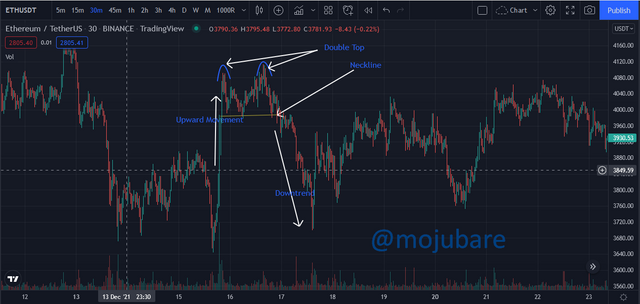
ETH/USDT
The ETH price went upwards from $3645 to $4093. At this point there was a spike in the volume of the market but when the formation of the double top begun, the volume reduced. The price dropped about 10% of its impulse uptrend movement and the formed a valley, after which there was an upward movement towards the previous high followed by a trend reversal downwards. After the price cross the neckline, the price starts to head downwards.
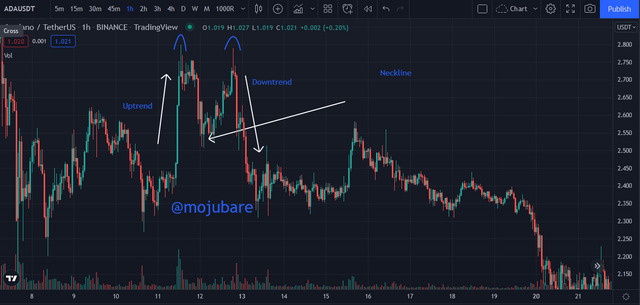
ADA/USDT
Using the ADA/USDT trading pair, there was an upward movement from $2.402 to $2.799 where there was a minor retracing which created a valley. then, the price move upwards trying to break the resistance but it failed and then a reversal occurred. The reversal crosses the neckline downwards, and a sell order can be entered.
Find and analyze at least 2 rising wedges and 2 falling wedges on at least 2 charts. Show your own screenshots
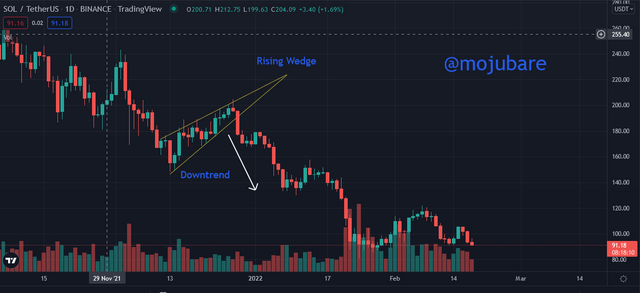
SOL/USDT
On the daily timeframe, the price of SOL was dropping from $243.14 and it had a support at $148.61 after which it stated to form a rising wedge as a result of a minor upward movement of price which moved upwards till $205.77 and then the price began to fall downwards as it breaks the wedge at $190.93.
YFI/USDT
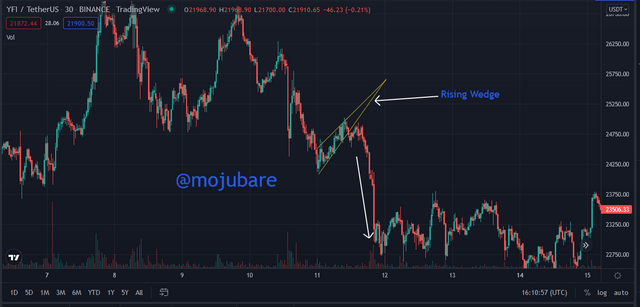
In the Above chart, there was a rising wedge which formed after a pause in the downtrend. The price started to fall rom $26878.90 and then had a pause and reversal. After the reversal, the price broke out of the wedge and continued in its downtrend.
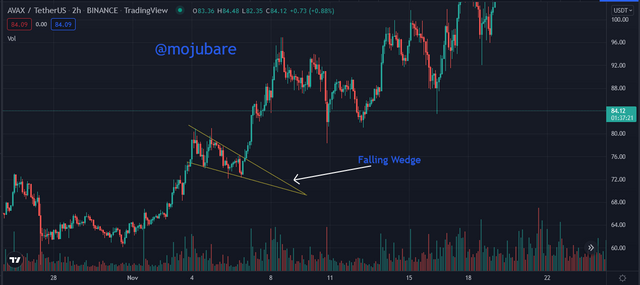
AVAX/USDT
This chart shows a falling wedge which is associated with uptrend. It occurs as a result of a break and minor reversal forming the wedge then the price continue its uptrend after breaking out of the pattern. In the chart, the falling wedge started from $83.93 and it breaks through the wedge at $75.77.
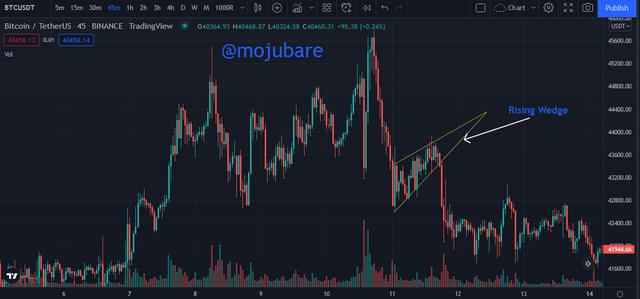
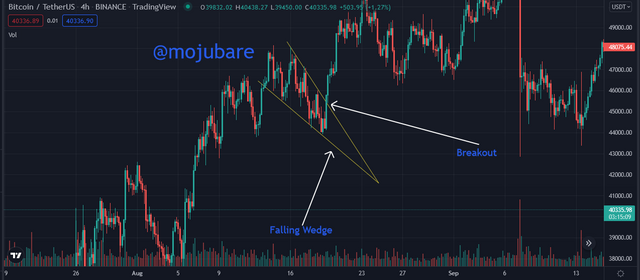
BTC/USDT
The BTC/USDT also shows a falling wedge where there was a pause in the uptrend causing a slight reversal. The trend continued after the price broke the falling wedge.
Importance of patterns in technical trading.
The ability to identify patterns make it easy or traders to trade the market with little risk. The market is a combination of emotions and psychology, unlike traders who cannot identify patterns, most traders who identify the pattern will trade along with the pattern and not against it. While there are a lot of traders that trade support and resistance alone, trading chart patterns also help to identify support and resistance easily.
The market is filled with uncertainty, and this uncertainty cause traders to trade wrongly but with chart patterns, there is an expected rule to be met for a pattern to be comfirmed and there is a rule determining the destination of the price once the pattern is broken.
Determining Stop loss and take profit is quite patterns. The speculated range for the price to move is always embeded in the chart and so it helps traders determine when to take profit and when to stop loss.
Do you find it effective to use these patterns in trading? Justify your answer.
I have been using chart patterns to trade for a very long time, and i have found it effective when it comes to trading. In some cases, I usually preffer trading them with technical indicators which gives me a precise decision. It is very difficult trading a naked chart or traidng a chart with indicators alone as indicators are always slow to react to the market but with chart patterns, future movement can be determined easily, and indicators can be used to validate the traders decisions.
It is in rare occasion that I have had issues with trading patterns as patterns do rarely gie false signals and when combined with indicator, they give the best results.
Conclusion
Chart patterns are a very useful tool for traders to trade successfully either when trading stocks, bonds, indexes, currencies, or cryptocurrency. It is a tool of rules and when this rules are followed (e.g: falling wedge = Uptrend,Rising wedge = Downward movement of price, head and Shoulder = Downward movement, e.t.c), traders make profit reduce losses.
While I love to trade chart patterns, I implore that trading a chart pattern alone isn't the best, it is important to trade the chart pattern with indicators thereby creating a good trading strategy.
Gracias por participar en la Sexta Temporada de la Steemit Crypto Academy.
Espero seguir corrigiendo tus futuras asignaciones, un saludo.