Puria Method Indicative Strategy- Steemit Crypto Academy- S5W4-Homework post for @utsavsaxena11.
. "Explain Puria method indicative strategy, what are its main settings. which timeframe is best to setup this trade and why? (Screenshot needed and try to explain in details."

This strategy is built using the combination of three indicators - two weighted moving (WMA) averages and a moving average convergence divergence ( MACD). The moving averages serves to indicate a threshold of a new trend and the end of the previous. Depending on the price action movement, the moving averages can serve as either support or resistance lines while the MACD calls out the signal.
With this strategy, a trader aims to make small but a more consistent profit over time since it favours short entries. The puria method indicative strategy has been about and has been used by traders for long but it became more pupular recently. Traders both old and new are fond of this concept because of it's simplicity and effectiveness.
HOW TO SET UP THE STRATEGY.
1• We need to add two period weighted moving averages.
In this example, I will use tradingview.com template.
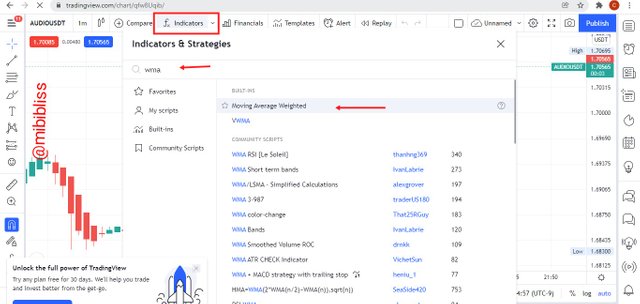
Goto the indicator menu. Click on the search box and type WMA or use the built-in option and scroll down to add our indicator. We will repeat the process to add two indicators.
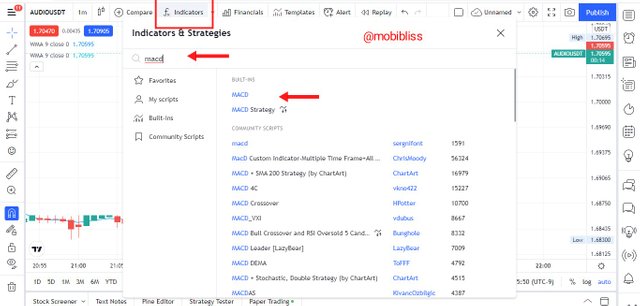
We should follow same method we applied when adding the WMA to add the MACD
2•
Upon the indicators added, we need to configure the indicators using the setup for this strategy. The setup are mentioned below.
Now to configure the indicators, I will goto indicator settings as I will indicate in the images below.
FIRST WMA SETUP.
For the first WMA, the recommended setup for this strategy is the period of 75. Then "source" should be set to "low". Time should be set same as timeframe. On the "style", I can choose any prefered colour.
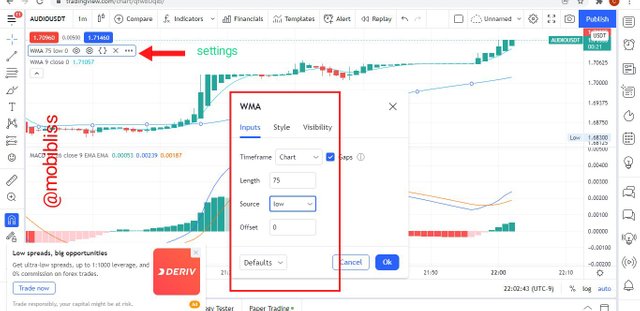
In the audiousdt chart above, I have applied the required settings for the first WMA of this strategy. Now I need to go to the "style" to choose the colour of choice. I my case, I have chosen blue.
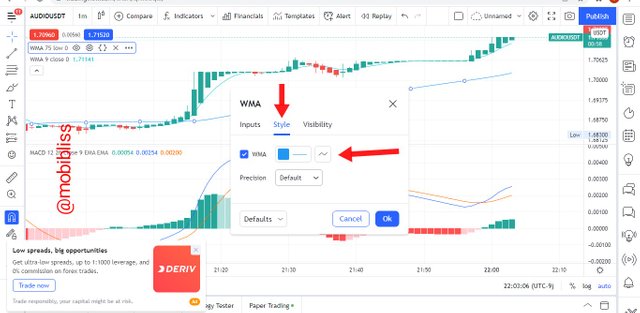
On the visibility, I left it as default.
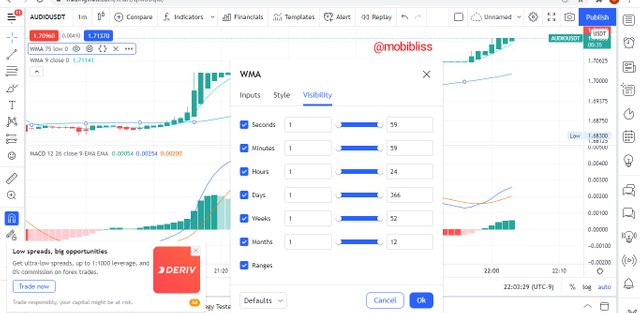
SECOND WMA SETUP.
In the second WMA, the required setup is the the period of 85. In the "source", we are to use "closed". Time should be same as with chart. On the style option, we are free to choose any colour of our choice.
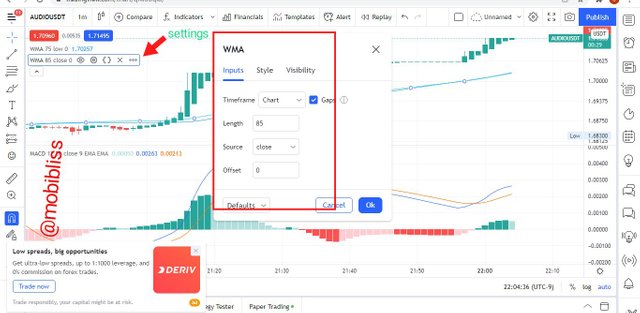
In the above image, I have applied the required settings for this strategy.
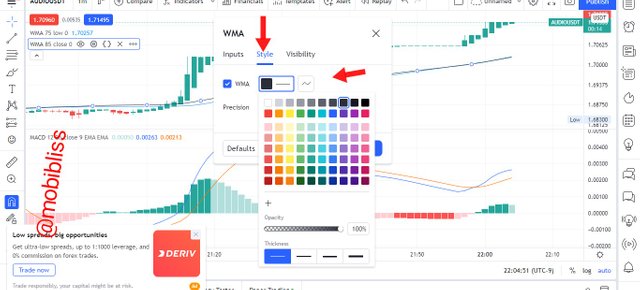
On the style, I have chosen black colour.
MACD SETUP.
On the MACD, we need to make some changes to the default settings. On the fast period, use the period of 15, on the slow period use 26. Also change the smoothing to 1. The smoothing settings will make our candles visibility to fade out leaving only the 0 line of the MACD visible. The reason for doing this is to make the signals easier to read and less confusing.
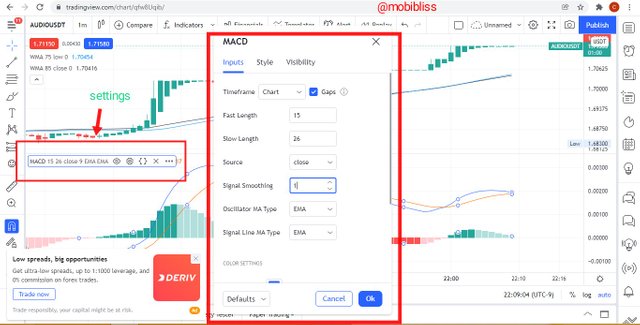
On the style area, we can select any colour of our choice. As for me, I will like red to be here and I chose it.
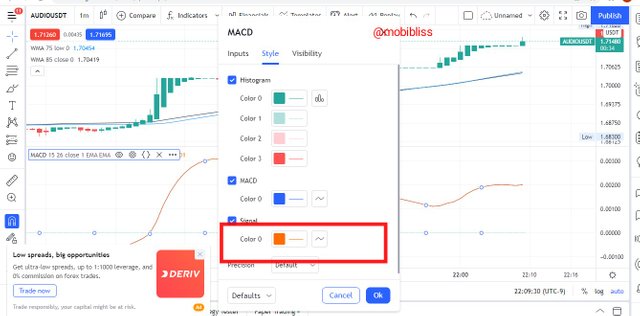
In the visibility, I used default setting.
Now the puria method strategy is fully set up, let's see how it appears on the chart.
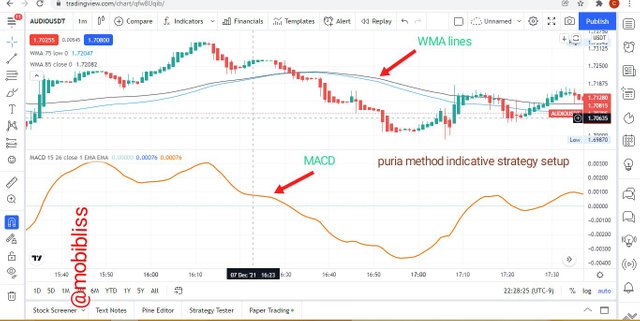
The two lines within the price chart of the indicator is the two added WMA indicators. The blue line is period 75 and the black line is period 85. At the bottom of the chart is the MACD indicator. What we can see is an MA line oscillating within a drawn line. The drawn line is the 0 point.
TIMEFRAME.
The suitable timeframe for this strategy is between 5 - 300 minutes. It can equally be shortened to as fast as 1 minute or less especially for those trading CFD markets.
The strategy is not designed for longer timeframe. Longer timeframe may take too long for a signal to be indicated and most times the accuracy is lesser than the ones observed in the shorter timeframe.
HOW THE STRATEGY WORKS.
The strategy follows an asset's trend therefore the focal point is to determine the trend using using WMA, then the MACD is used as a confirmation tool to further support the signal of the weighted moving average.
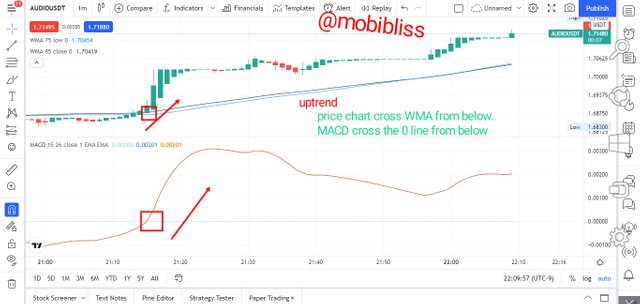
As noted, the WMA lines can serve as support or resistance lines, when the price chart crosses the two WMA from bottom to top it is an indicator that a buy signal is about. We need to confirm the signal using the MACD. When the 0 line of MACD cross from bottom to top then it is a confirmation of the signal and the trader can open hope to open a position after the next candle.
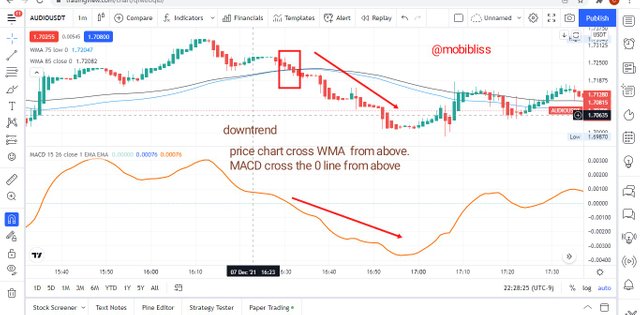
Same is applicable for sell trade, when the price chart cross the two WMA from top going below, it is a sell trade indication, the trader will need to wait for the MACD to cross from above the 0 line to below it to confirm the signal.
WRONG SIGNAL TRADE.
A signal is wrong when it does not meet the above criteria. For example, if the price chart did not cross the both WMA but the MACD has crossed, then we should wait untill the price chart crosses. Same is true in the opposite, If the price chart crosses the WMA, we need to wait till the MACD crosses the 0 line before placing a trade, failure to obey this rules will result to wrong signal trade.
"2. How to identify trends in the market using the puria method. Is it possible to identify trend reversal in the market by using this strategy? Give examples to support your article and explain them. (screenshot needed)"
HOW TO IDENTIFY TREND USING THE METHOD.
We have already pointed out that the puria method indicative strategy follows the trend of an asset. Usually we can merely notice a trend by looking at the chart. Using charts like heikin ashi candles with it's smoothed appearance, we can easily spot out a trend. When we see more green candles lined up, we know it is an uptrend, when we see more red candles lined down then we know it is a downtrend. But by using this method, we can confirm when the new trend is likely to continue.
Most of the time, price rally around the WMA line, when it happens, it may be difficult to pin point the very trend of the asset. To be clear hear, a cross of the asset price chart to either direction determines the trend.
Uptrend
An uptrend is determined when the price chart crosses the two WMA from the bottom towards up and remains above the WMA. Once this happens a trader will be alert for opportunity to enter a "buy" trade .
Downtrend.
Downtrend is determined when the price chart crosses the two WMA from above towards the bottom and stays below the WMA.
Determining Reversals.
Reversals are determined in same way as the up and downtrend. Usually a change in direction of the trend means a reversal to either bearish or bullish. In an event like the example sited above when price is indecisive, reversal can be determined at a cross of the price chart to either side.
Bullish reversal
A bullish reversal is determined when the price chart crosses from below to above the two WMA. The cross signals that the price chart has left the former bearish trend and now the trend is bullish.
Let us remember, that the two WMA lines serves as our support when it comes to bullish moves. It is at this point that we hope that a true reversal has occurred and we now on a bullish trend.
Bearish reversal
A bearish reversal can be determined when the price chart cross from above to below the WMA line. There was an already established bullish trend and now the price chart has reversed crossing the WMA from above to below.
Just like in the bullish, the WMA can serve as our resistance lines, a price chart crossing it means that the bearish trend is the current trend.
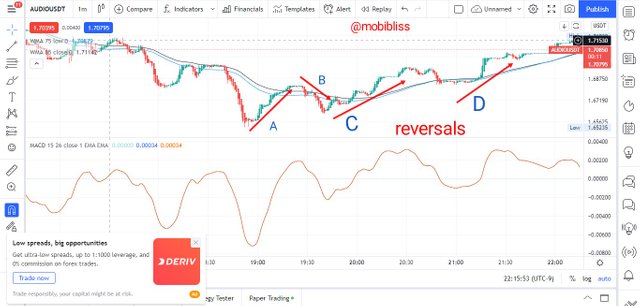
In the chart above, at some time, the price rally around the WMA line. At point marked B we can notice a cross to below the WMA line, this shows a bearish reversal. At point C and D , price chart crosses above from below the WMA line and this shows a bullish reversal.
"3. In the puria strategy, we are using MACD as a signal filter, By confirming signals from it we enter the market. Can we use a signal filter other than MACD in the market for this strategy? Choose one filter(any Indicator having 0 levels) and Identify the trades in the market. (Screenshot needed)."
One indicator to use is the Relative strength index RSI. RSI has a bounded line of 0 - 100 percent. When the RSI indicator is above is below 30 percent, it is considered an oversold area and a possible bullish reversal is about, when the RSI is above 70 percent area it is considered to be oversold and a possible bearish reversal is about.
But using the puria method, we are after the trend, therefore, the 50% area of the RSI indicator is the bench mark. If the RSI indicator
cross the 50% line from above ( that is a decreasing count from 100), it confirms a bearish trend, conversely when the indicator crosses the 50% line from below ( an increasing count from 0 ) then we are in an uptrend.
Combining RSI to our strategy, RSI can be used as a confirmation tool. See example below.
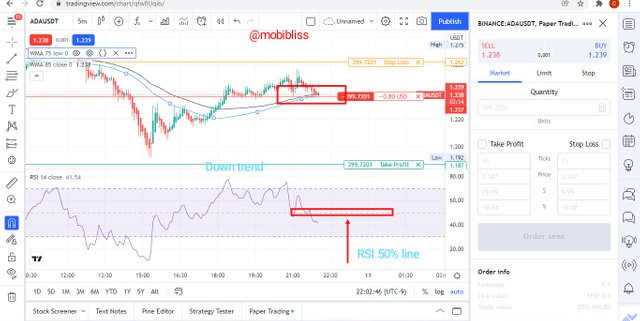
In the image above, I took a sell trade, when the price chart crosses the WMA line, if you look in the RSI indicator, we can notice that it has crossed the 50% line from above, with that I confirmed my sell trade signal.
"4. Set up 10 demo Trades (5 buying and 5 selling ) on 5 cryptocurrency pairs using puria method indicative strategy. Explain any 2 of them in detail. Prepare a final observation table having all your P/L records in these 5 trades."
In this exercise I used iqoption.
Sell trades.
First trade
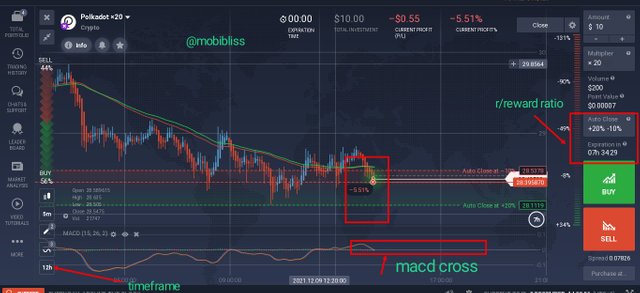
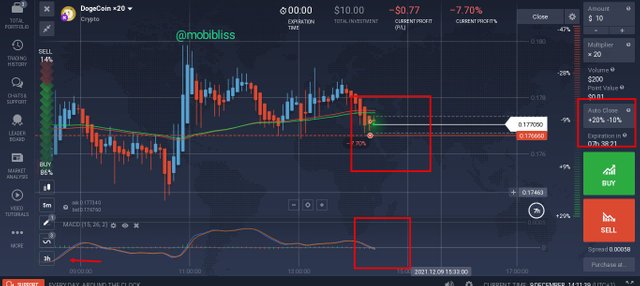
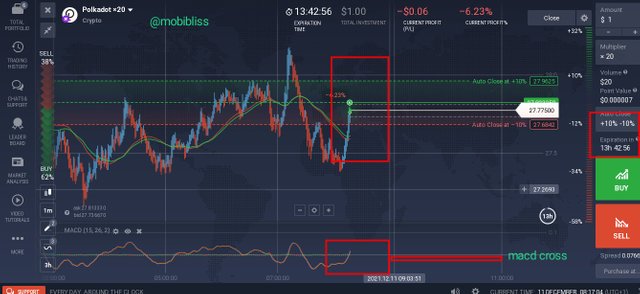
In the trade of polkadot below, I applied all the requirements for this strategy.
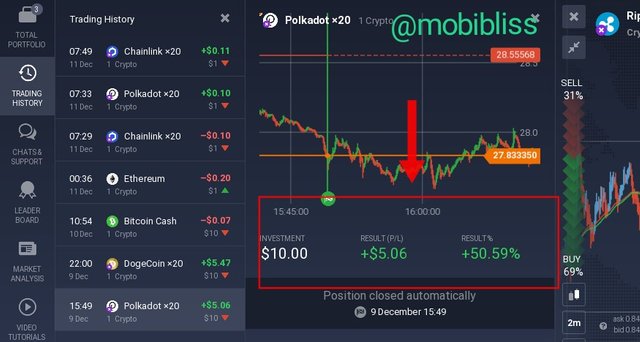
I entered the trade when price chart cross WMA lines. I waited for the MACD to cross the 0 line. I used 2.1 r/r ratio. I invested $10 and I made a profit of $5.06.
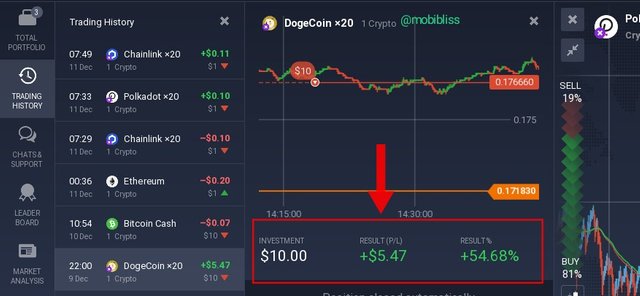
Profit.
Second trade.
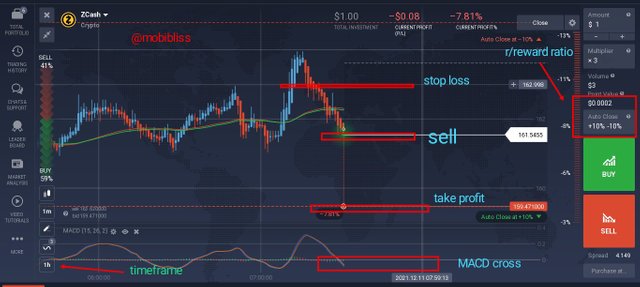
In the Zcash chart above, I placed a sell trade when the price chart cross the WMA from above. I waited for the MACD to cross to confirm the signal. The timeframe I used was 1 hour timeframe. Risk to reward ratio was 1:1 . However due to a pull back in the opposite direction, the trade ended up in a loss of $ 0.10 USD .
Third trade.
Fourth trade.
Result.
Fifth trade.
SELL TRADE TABLE.
| S.NO | PAIR | BUYING PRICE | SELLING PRICE | P/L | TIMEFRAME. |
|---|---|---|---|---|---|
| 1 | dot | $ 28.39 | 28.11 | $5.06 | 5 mins |
| 2 | Zcash | 161.5 | 162.9 | - $0.10 | 1hr |
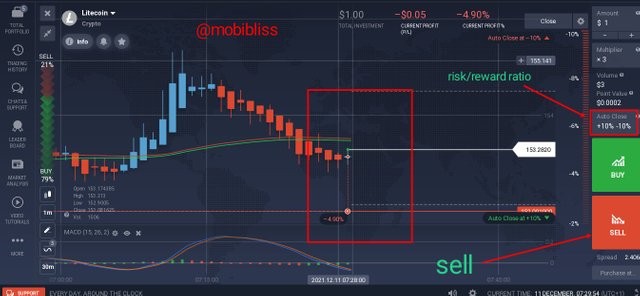
| 3 | Litecoin | 152.0 | - | - $0.10 | 30 mins |
| 4 | dogecoin | 0.176 | 0.171 | $5.47 | 3hrs |
Buy Trades.
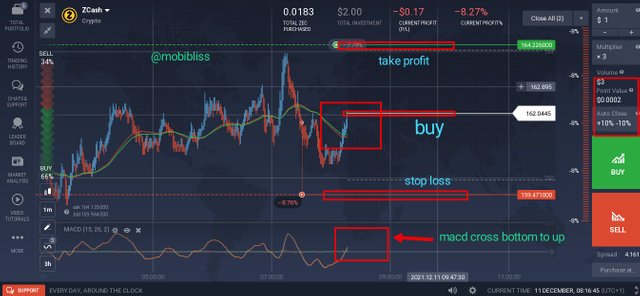
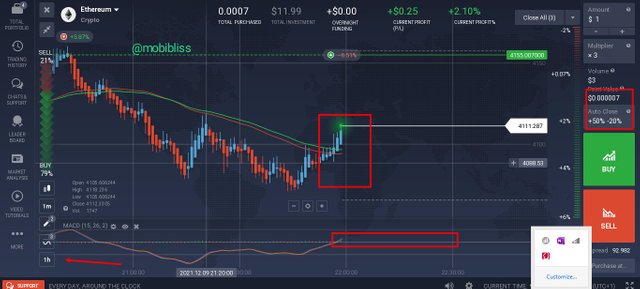
In the Zcash chart above, all the needed requirement for buy trade are met. The price chart crosses the WMA from below. I waited for the MACD to cross the 0 line. I placed a buy order when Zcash is 162.0445.
Second Trade.
Third Trade.
Fourth trade.
Fifth trade.
| S.NO | PAIR | BUYING PRICE | SELLING PRICE | P/L | TIMEFRAME. |
|---|---|---|---|---|---|
| 1 | Zcash | 162.0445 | - | - $0.10 | 3hrs |
| 2 | dot | 27.77500 | 27.9624 | $0.10 | 3hrs |
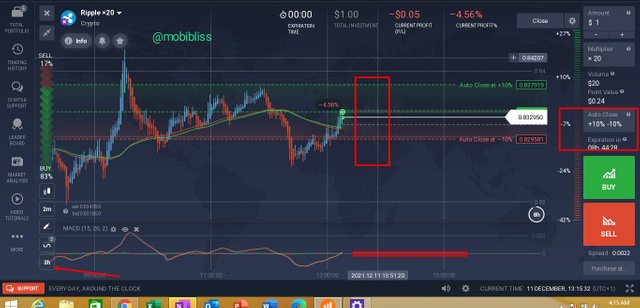
| 3 | ripple | 0.832950 | - | - $0.10 | 3hrs |
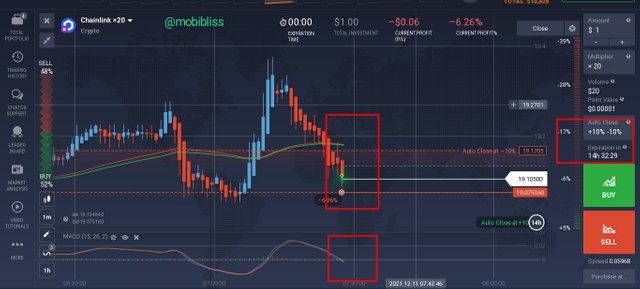
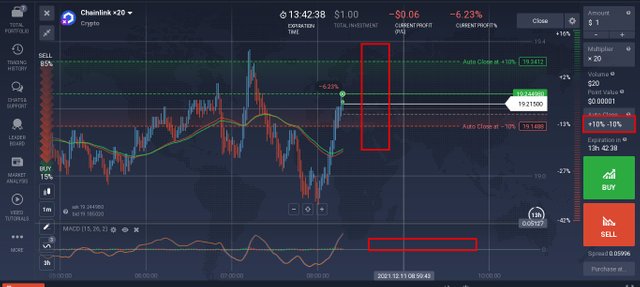
| 4 | chain link | 19.24498 | - | - $0.08 | 3hrs |
| 5 | ether | 4155.00 | - | - $0.20 | 3hrs |
"5. You have to make a strategy of your own, it could be pattern-based or indicator-based. Please note that the strategy you make must use the above information. Explain full strategy including a time frame, settings, entry exit levels, risk managment and place two demo trades, one for buying and the other for selling."
Bollinger band breakout strategy.
In this strategy, I use the Bollinger bands indicator and a confirmation tool RSI. Usually, the bollinger bands try to determine overbought and oversold positions of an asset price. When the price chart touches or crosses the upper bollinger the price is considered overbought and a reversal to the bearish is possible Bollinger. Conversely, when the price chart touches the lower bollinger, it is considered oversold and a possible bullish reversal is possible. The middle band of the bollinger can serve as a support or a resistance depending on the asset's price movement. A breakout occurs when the price chart crosses the upper or lower band of the bollinger.
In this strategy however, our concentration will be on breakouts, we only trade when a breakout has occurred.
Strategy Setups.
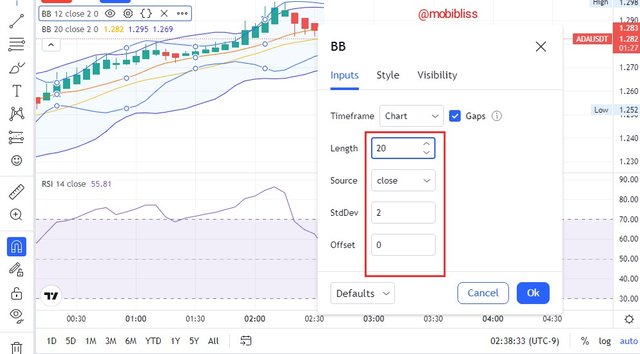
To setup this strategy, we will add two Bollinger bands indicators. Then we add RSI.
On the first bollinger band, leave the inputs at default.
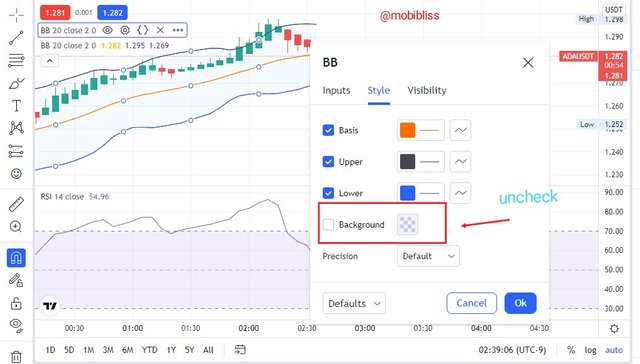
On the style, choose colour for lower, middle and upper bands or leave it at default. Uncheck the background to remove the shade.
Set the visibility to default.
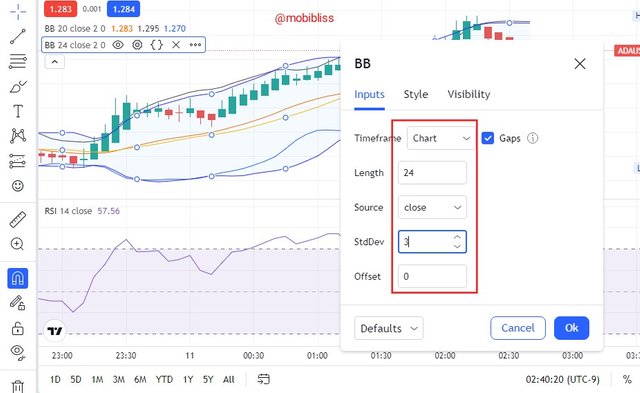
On the second Bollinger bands, use the following settings.
On the Length, use 24. Set standard deviation to 3, leave the rest at default.
On the styles use the following settings.
Uncheck the basics. The reason is to have one center line. Also uncheck the background to remove the shades.
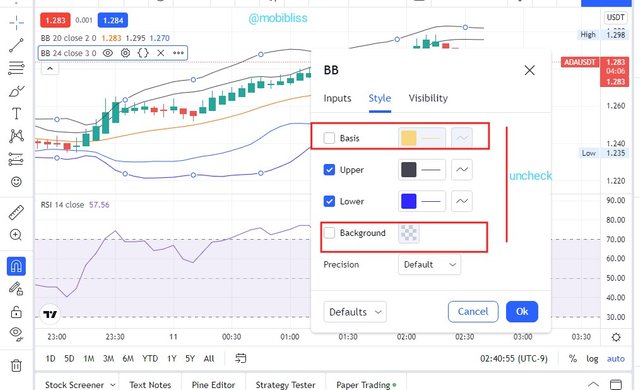
On the visibility, set to default.
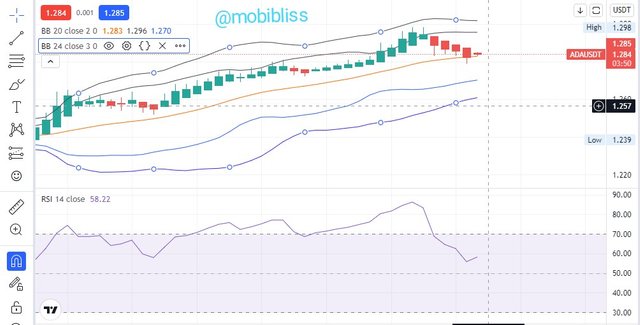
Leave RSI settings to default. Now we have our indicator set up.
Time frame.
This strategy works best on shorter timeframes. I have texted on 5 minutes to 30 minutes timeframes. However, you can text this strategy on longer timeframes. If you are an option trader, use one minute candles and choose 3 minutes expiration period.
Sell Signal
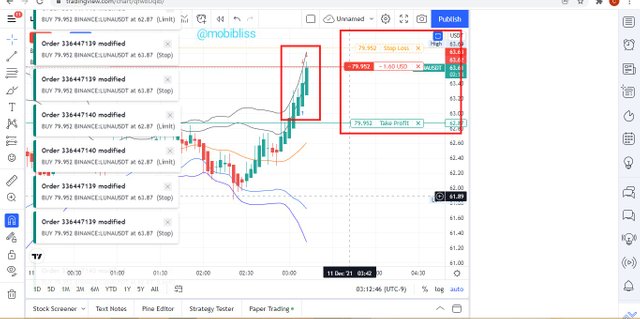
Once the price chart crosses the first upper Bollinger bands or between the two upper bands above and the RSI is in it's overbought area, enter a sell position. Target the middle bollinger as first take profit and lower bollinger as second take profit or use 1:1 or 1:2 risk to reward ratio. Place stop loss below at the last bollinger band. If the price broke the two upper Bollinger, also trade sell.
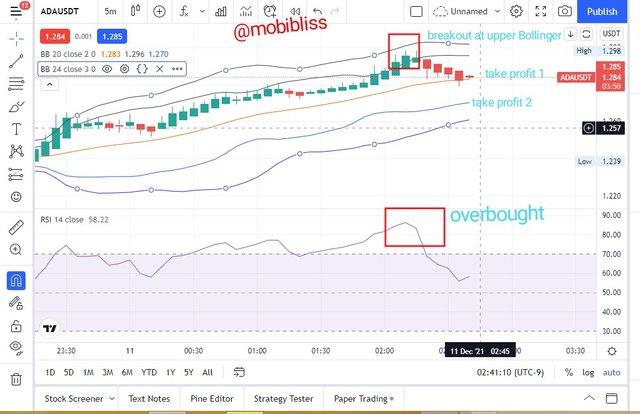
In the image above the price chart is between the two Bollinger and we have our confirmation from the RSI that the price is in it's overbought area.
Buy signal.
When the price chart crosses the two lower bollinger bands and the RSI is in it's oversold area, enter a buy trade. Place stop loss below the lowest band. Target the middle bollinger as first take profit and the upper bollinger band as the second take profit.
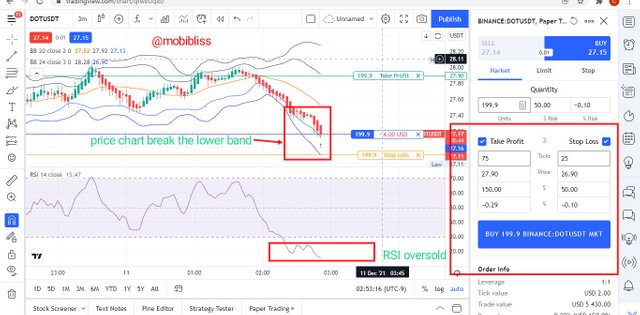
In the image above, the price chart broke the lower bollinger. The RSI is in it's oversold position.
Note: all images are drawn from tradingview.com demo source and iqoption app.