CRYPTOACADEMY/SEASON 3/ WEEK 8 - INTERMEDIATE/ CRYPTO ASSETS AND THE RANDOM INDEX (KDJ)

INTRODUCTION
I am glad to be in your class this week 8 of cryptoacademy season 3 professor @Asaj. It is indeed a good class on the Random index indicator. I must also use this medium to commend the work you steemit professors are doing and equally, the idea of the #steemit cryptoacademy. Thank you very much.
The use of technical analysis dated back in the 1800s, firstly introduced by Charles Dow with his Dow Theory. Other contributors to the early stage of technical analysis includes noteworthy researchers like William P. Hamilton, Edson Gould, John Magee , and Robert Rhea.
The entire concept has been the analysing of investments using it's past historical data. These process has given rise to the development of many technical analysis tools that we know as technical indicators. Some of these indicators tends to indicate entry and exit positions of any tradable asset, others are built to identify trend, whereas yet others tell us the strength of the trend of the asset. The Random index on the other hand is among the indicators that tends to combine two or more functions; it helps us to identify the trend, tell us possible reversal points, and at the same time gives signals for buy or sell.
In this post, we shall discuss in full the Random index Indicator (KDJ), how to add it to a chart and how to trade with it. We will equally compare it to some other indicators like the ATR and ADX. The presentation will follow as a response to the questions which forms the expectation guideline for this post. We shall endeavor to adhere rigidly to this task's guideline. See guideline below. *
TASK EXPECTATION GUIDELINE: *
- In your own words define the random index and explain how it is calculated
- Is the random index reliable? Explain
- How is the random index added to a chart and what are the recommended parameters? (Screenshot required)
- Differences between KDJ, ADX, and ATR
- Use the signals of the random index to buy and sell any two cryptocurrencies. (Screenshot required)


Question 1
WHAT IS RANDOM INDEX (KDJ)?
The random index is equally called KDJ or sochastic index. It is an indicator consisting of three swinging lines; an additional line ℅J plus the two lines already present in sochastic oscillator ℅k, and ℅D. The indicator like the sochastic oscillator takes advantage of the speed to which price of an asset fluctuates to determine when a possible reversal could happen; an asset's overbought and oversold positions even before the actual change in price occurs. It carries combined element of the momentum concept - that the momentum of an asset price must change first before the actual price changes, moving averages and trend strength indicator. The indicator takes the current closing price and compares it with the highs, lows, and closing price within a given period and then obtain it's index by smoothing the corresponding data.
The Random index was first used to analyze the price of features and later was applied to stocks. Since it is a trend following indicator, experts recommend it for ranging markets and short and medium time positions.
The random index KDJ is modeled after the sochastic oscillator. It has same bounded price range like the sochastic oscillator, with price measurement ranging from 0 - 100%. 50% is considered the middle point. Prices above 50% could be seen as within overbought areas, moreover, prices below 50% could be interpreted as within the oversold area. Prices within the middle point can represent indecision; the buy and sell pressure are at equilibrium and therefore a trader requires some patience for the market to take a side before entering a trade. Because traders using this indicator are more concerned with reversals the concentration is on the overbought or oversold areas. In other to understand the random index, let's first get some idea from the sochastic oscillator. I made a brief post about the sochastic oscillator in this link
The sochastic oscillator has four components.
Two horizontally drawn lines indicating the overbought and oversold positions. The ℅k line which is a fast moving swinging line, and the %d line which is slower. The indicator has a measurement ranging from 0 - 100. Price of an asset is considered truly overbought when it crosses 80℅ area which is the upper horizontal line. On the other hand, an asset price is considered oversold when it is below 20℅ , which is the lower drawn line of the indicator. A signal for buy or sell is sent when the two lines of %k and ℅d intersects within the overbought or the oversold positions.
What we see on the random index is same but the addition of the ℅J. The indicator therefore consists of five components.
*the ℅k line.
- the %d which is a three day Simple moving average of %k
- ℅J which is a divergence of ℅k and %d.
- The overbought areas
- The oversold area
In some charts the %J being the active signal indicator is often coloured green. This colour is subject to change by a user's desired configuration.
CALCULATION OF THE RANDOM INDEX
The calculation of the random index are in stages. The calculations are not that simple, yet we can attempt to understand it.
Firstly, we need to get the immature random index value of the number of periods (RSV)
Secondly, we will calculate the %K, %d and %J.
To begin we need to first get the period that we are working with. Let's say we are working with the standard period of 9 for the kdj, RSV will equal.
RSV = (c9 - l9) ÷ (h9 -l9) × 100
To understand this simply. Remember we are working with the period of 9. Let's take that 9 to be 9 days.
RSV = ( current closing price within 9 days - lowest price within 9 days) divided by ( highest price within 9 days - lowest price within 9 days) multiplied by 100.
In practice, let's say that the current price of steem as at today is $2, all time high within 9 day period is $3 and the lowest price within the 9 days period is $1
RSV will equal. RSV = $(2 - 1) ÷ (3 - 1) × 100
The reason for multiplying by 100 is because price fluctuates from 1 - 100%.
Second stage. We will get our %k, %d and %J.
%K for the current day = 2/3 × %k for the previous day + 1/3 × RSV for the day.
%D day value = 2/3 × %D value of the previous day + 1/3 × current day %k value.
%J = 3 × day value of k - 2 × day value of D.
HOW RANDOM INDEX KDJ WORKS.
The indicator sends a signal when the lines of the KDJ intercepts. The crosses are similar to moving averages "golden cross" and " death Cross". When the J line crosses the the k and d from bottom to top, it is a buy signal. When the J and K line crosses the d line From bottom to top, it is equally a buy signal.
When the J line crosses the k and d line from top to bottom, it is a sell signal. When the J and K line crosses the d on same way, it is a sell.
When the J line stays above the k and d line, it is an uptrend; conversely, when the J line stays below the K and D line the trend is downward.
The drawn upper line indicates overbought area and when the J line is above 90% and all the lines k and d are within the overbought area, we have possible sell signal.
The drawn lower line signifies oversold positions and when the J line is lower than 10% area, and all the lines k and d are within the oversold area, we have possible buy signal.
- Please note: signals are sent when the three lines of the random index intercepts. It could happen anywhere within the percentage range of the indicator. Meanwhile, I recommend waiting for all the conditions above has taken place. This may limit false reversals and hence wrong entry.
determining when not to trade
When the three lines of the random index intertwine, it means the market is flat. The indicator do not work well on flat markets. it is therefore advisable for a trader to hold and not trade on this condition.
Having noted these points , let's see if our indicator will work the talks.
Question 2
IS THE RANDOM INDEX RELIABLE?
The better way to answer this question is to apply our indicator to a chart and compare it's signals against what is obtained from the price chart.
Here I will use a chart price of Ethereum/USD. See fig. 1.
Fig 1.
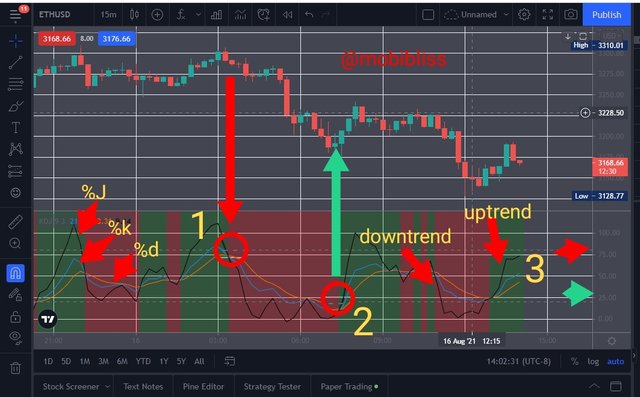
Eth/USD. Tradingview.com.
Sell signal
Let's take a closer look at what is happening in the chart. At point "1" the lines of the random index indicator intercepts. The Black line was above the blue and yellow. The point of intersection signals a "sell". I drew a red arrow indicating "sell". At the corresponding position in the chart above, we notice a downward movement of the candlestick. The prediction was correct. Take a look at point "3". The place with the red arrow shows the KDJ percentage, it is above the drawn 75% line.
Conditions for sell signal
- price need to be above the 75% area preferably
- all indicators are within the overbought area.
- %J and ℅k crosses from above to below %d.
Buy signal
At point labelled "2" in fig one, we noticed that all conditions for buy are all met. At point 3 axis we can see the green arrow showing the percentage label of the indicator.
conditions for "buy"
- price need to be below 25% oversold area.
- all indicators need to be within the oversold area.
- %J line and %K will cross %d line from bottom to top and stay above it.
Usually traders expect market to make a reversal at overbought or oversold areas. The random index has already pointed out these areas for us. Price need to be at these areas for a valid reversal to take place. However, more than just getting to overbought or oversold areas, the indicators need to intercept for a signal to be sent. At other times, traders choose to examine the percentage of the J line, being above 90% or below 10% may indicate that possible reversal is about.
Bottom line
The random index gives good signals, however, no indicator gives 100% accurate prediction. Therefore combining it with other indicators is recommended. The indicator works better in ranging markets, at flat markets the lines intertwine and a trader need to use caution or avoid these times entirely.
Question 3
HOW ARE THE RANDOM INDEX ADDED TO A CHART?
This indicator will be added to tradingview. We shall also see how to setup the indicator and the recommended parameters.
Fig 2.

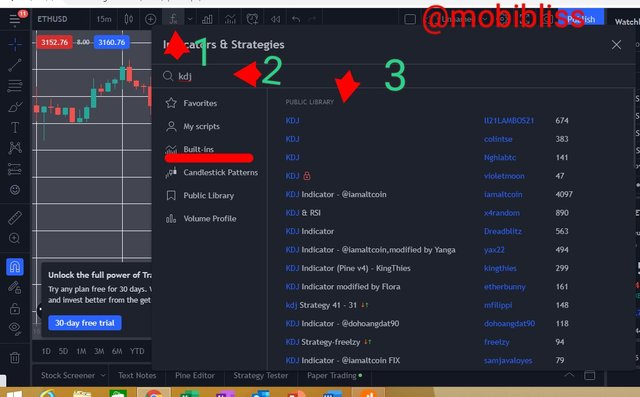
Goto tradingview.com and click on Chart. See fig 2.
Then go to the indicator tab and click on it.
On the window that appear, go to built-in, scroll down to select indicator or you can type kDJ on the indicator box. Choose the first option. This is already configured strategy by an expert in tradingview. Once done, we have successfully added our indicator. See steps in fig 3.
Fig 3.
Recommended parameters
Another thing to do after adding our indicator is to set it up for preferred inputs and appearance. However, we are using an already configured indicator. The settings will reveal the indicators configuration. Let's take a look.
Goto indicator settings, find the inputs.
Fig 4.
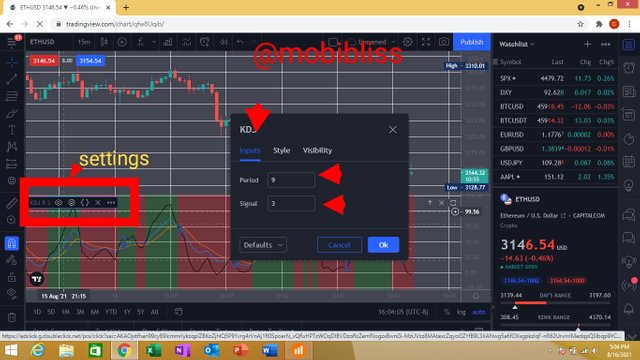
In the "inputs", the number of period is 9. This is the recommended parameter.
The number of indicator is 3; the K, d and J .
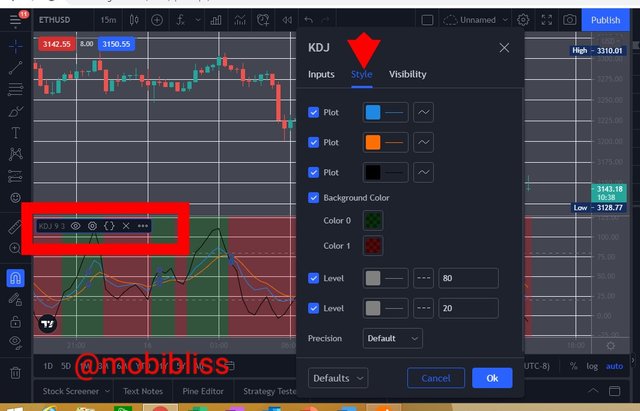
In the "style" option , we can change to preferred colour of these indicators. We can also set the percentage of the overbought and oversold lines to our preferred configuration.
In fig 5. 80 levels are for overbought position and 20 levels are for oversold position. This is the standard configuration.
Fig 5.
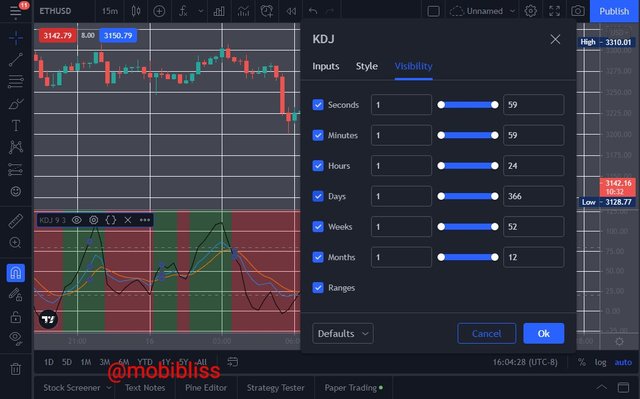
The third thing to set is the visibility. Allow it to default.
Fig 6.
Bottom line
The standard configuration for the periods is the period of 9.
The standard configuration for overbought position is 80% levels.
Standard configuration for oversold area is 20% level.
Question 4
WHAT IS THE DIFFERENCE BETWEEN KDJ, ATR, AND ADX?
ADX
ADX means average directional index. It is often plotted along with the directional movement indicators (DMI) making them a three line indicators. The indicator has a value ranging from 0 - 100. It is used to determine how strong the trend of an asset is.
Directional movement indicators (DMI) are indicators consisting of two lines of positive directional movement (+DI) and negative directional movement (-DI). The indicators are gotten by comparing previous highs and lows of an asset and then determine it's trend movement wether uptrend or downtrend. When the +DI line is above the -DI line it indicates an uptrend. When +DI line is below -DI line it indicates a downtrend.
When DMI is plotted along with ADX indicator, the later measures the strength of the trend in whatever direction the DMI moves, positive or negative. What ADX tells you is how strong the trend of the asset is.
Fig 6. ADX Indicator. iqoption.
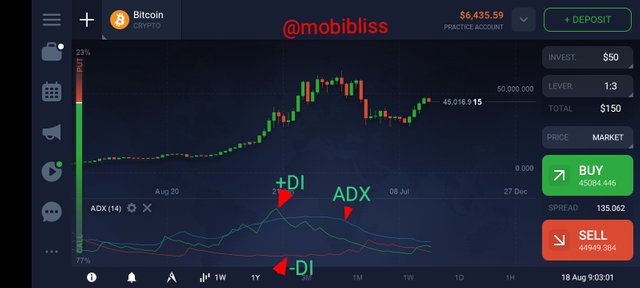
When the ADX indicator reading is within 0 - 25% it means a weak trend. 25 - 50% means a strong trend. 50 - 75% means very strong trend and 75 - 100% indicates extremely strong trend.
ATR INDICATOR
ATR means average true range. It is an indicator with a single oscillating line plotted as a moving average of an asset's price movement within a given period. ATR measures the range to which an asset price moves overtime. ATR do not tell us the trend or price direction, it simply tells us how volatile the price of an asset is over a given period.
Fig.7 ATR Bitcoin day timeframe chart. Iqoption.
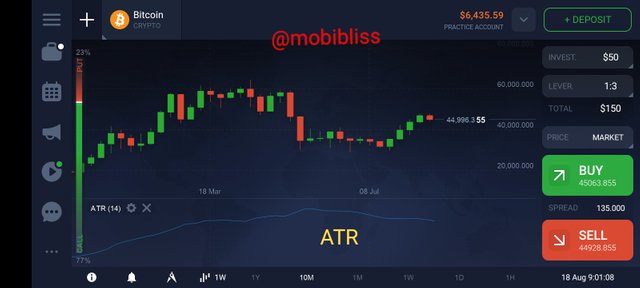
When the line of the ATR is up it shows high volatility, when the line of the ATR is down it shows low volatility. The standard period is 14.
As it is the case in the fig 7. above, ATR will measure at what pip the price of Bitcoin moves within 14 days. These will provide a trader with vital information. Traders can use it to ascertain which trade to enter, when it is best to enter the trade and equally use it to manage risk.
As we may have noticed, the three indicators, the KDJ, ADX and ATR share some similarities. For example, the indicators can tell us when it is good to enter a trade. However, there are differences.
Differences
KDJ informs a trader on what the trend of an asset is at a given point in time. It shows if the asset is overbought or oversold therefore identifying possible reversal. It gives signal on buy or sell. ADX on the other hand do not tell us direction of trend nor does it give us buy and sell signals or asset's overbought or oversold positions rather it informs us a trader on how strong the trend of the asset is irrespective of the direction of the trend.( It is important to note that ADX is it's own indicator but could be added to the DMI indicators). ATR tells us something completely different. It do not inform us about trend or trend strength, but rather the range of volatility of the asset price within a given period.
DIFFERENCES .
| KDJ | ADX | ATR |
|---|---|---|
| Trend direction | trend strength | price volatility |
| Reversal points | - | average pip range |
| Buy/sell signal | - | - |
Question 5
USE THE SIGNALS OF THE RANDOM INDEX TO BUY AND SELL ANY CRYPTOCURRENCY.
Already, we have shown conditions to buy and sell with Random index indicator, we will demonstrate these using BTC and cardano ADA.
Note: images may appear smaller
Fig 8. BTC KDJ buy signal. Iqoption.
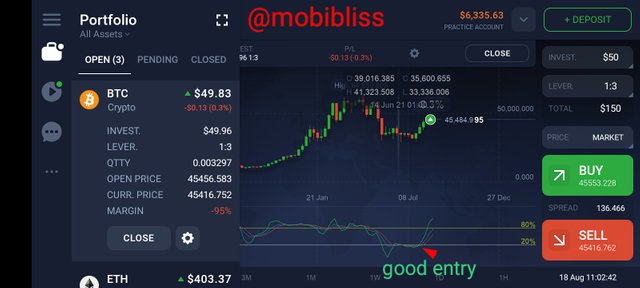
Notice in the chart above that all the conditions for buy signal were met. The indicators were within the oversold area. The green %J crossed k and D from bottom to up.
Fig 9. Cardano ADA sell signal iqoption.
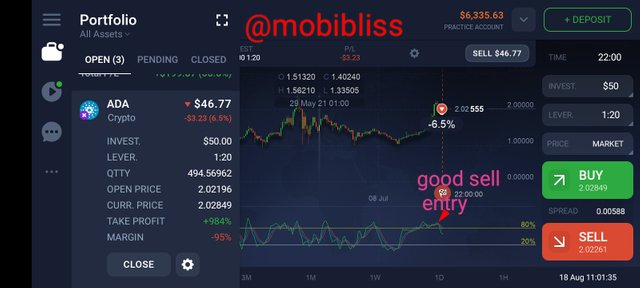
What we have in the cardano chart is a good sell entry. The indicators are within the oversold positions. Notice the crossing of the green %J line from above to below.
CONCLUSION.
Technical analysis has come to stay. Despite the fact that it is impossible to accurately predict the future, the use of indicators has attempted with seemingly closer accuracy to predict market movements and offer traders good entry and exit positions.
Moreover all indicators do not do the same work. For example, Random index combines three functions. It informs trend, show reversal points and give buy and sell signals.
ADX tells us how strong a trend of an asset is irregardless of trend movement.
ATR informs us of the range of volatility.
Combining more than one indicator has always been an ideal recommendation.
Thank you once again prof. @asaj. Thank you #Steemit.
Superb performance @mobibliss!
Thanks for performing the above task in the eighth week of Steemit Crypto Academy Season 3. The time and effort put into this work is appreciated. Hence, you have scored 10 out of 10. Here are the details:
Remarks
You have displayed a good understanding of the topic Chimaobi Nwaeze. You have completed the assigned task. Your have performed the tasks in a commendable fashion.
Thank you so much