CRYPTOACADEMY HOMEWORK TASK//SWING TRADING//#YOHAN2ON-S2WEEK7
WITH YOUR KNOWLEDGE OF TECHNICAL ANALYSIS DEMONSTRATE YOUR UNDERSTANDING OF SWING TRADING
I understood that the purpose of the cryptoacademy is to help newbies have a basic to comprehensive knowledge of the crypto world. Therefore I will endeavour to make my presentation as simple as possible. We will first understand what swing trading style is. Next, we shall discourse how to analyse trend movements. Then finally, we will demonstrate how to trade using this trading style.
WHAT IS SWING TRADING STYLE
Swing trading is a trading method whereby a trader tends to make small profit as the price of an asset swings within a particular trend.
Markets charts make differing movements. It can move in zigzag pattern, it can form waves, it can swing. swinging in the sense that it oscillates, swinging to a high up and swinging to a high down. When a chart of an asset behaves this way, we say that the market is trending. Within these movements, a swing trader's goal is to find an entry point to execute a trade and find an exit point to exit the trade when profit has been made. He would equally have a good loss management plan so that when a trade goes against his prediction it will not result to total loss of all his funds or perhaps the total loss of the profit already made.
Swing trading is similar to scalp trading style. The very difference lies in the time period it takes to hold a trade. A scalp trader hopes to make small profit from price movements within minutes, whereas a swing trader can hold a position for longer like hours, days, weeks and even months.
The very one advantage of the swing style over the scalp style is lesser stress. A swing trader do not need to stress himself watching his trade like the scalp trader would; once the trade is set up and executed he could go and rest waiting for the trade to hit his expected target. In case the trade move against his prediction, the trade will close at his set stop loss limit.
Because of the time frame involved in the swing trading style will affect how we will do the analysis to determine trend. It will equally affect the kind of indicators we will use.
We shall now look into how to identify a trend. We shall mention the indicators for this purpose and why they are chosen.
HOW TO IDENTIFY A TREND
To identify a trend we will make use of moving averages. We shall use simple moving averages SMA. The reason for simple moving averages is because it lags in it's signal. The lagging helps corrects weak signals. Exponential moving averages EMA are faster and and better suited for scalp trading. Simple moving average will be useful because we want to analyse a trend over a longer period of time and with different time frame. Let's therefore jump in to see how to set this up in our metatrader.
- NOTE: I AM USING AN ANDROID VERSION OF METATRADER. THE PHOTO MAY NOT APPEAR CLEARER AS IT WOULD IN THE DESKTOP VERSION.
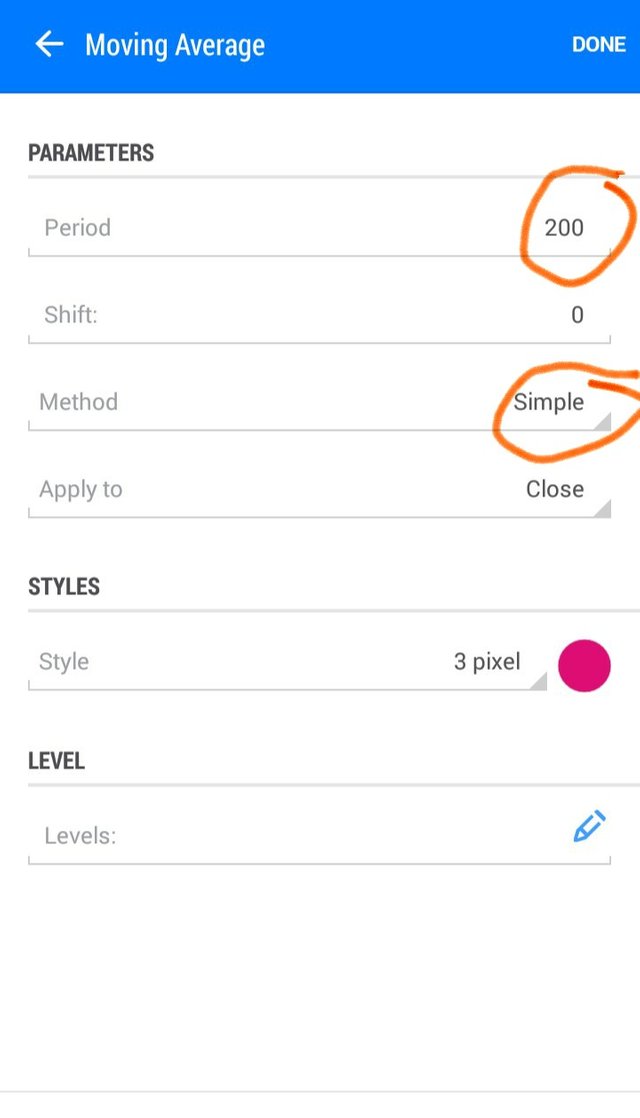
First we will select a period of 200 SMA.
goto indicators, moving averages, simple moving averages. - fig1.1
We shall select our pair as BTCUSD
We share identify the chart trend of BTCUSD over different time frames.
W1 = 1 week timeframe
D1 = a day timeframe
H4 = 4 hour timeframe
H1 = 1 hour timeframe
We hope to take our trade in 1hour timeframe, but because we may hold our position longer than an hour, we want to see how the market has performed over longer periods to help us reach a better conclusion. We share begin by examining the trend from one week timeframe.
Fig 1:2
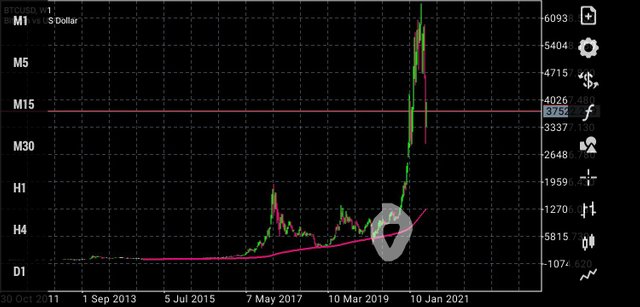
What we see circled is our 200 period sma.
The principle for identifying the trend is simple: when the 200 SMA is below the candle chart, it is an uptrend, when the 200SMA is above the candlestick chart, it is a downtrend. Practically we can see from the photo that we have an uptrend.
Fig1:3
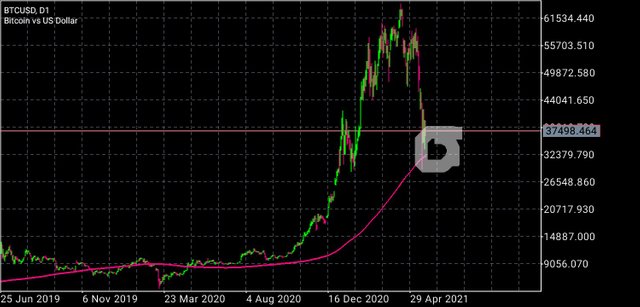
Fig 1:3 is a day timeframe, it shows an uptrend but strong indication of a change in the trend at the point circled.
Fig 1:4
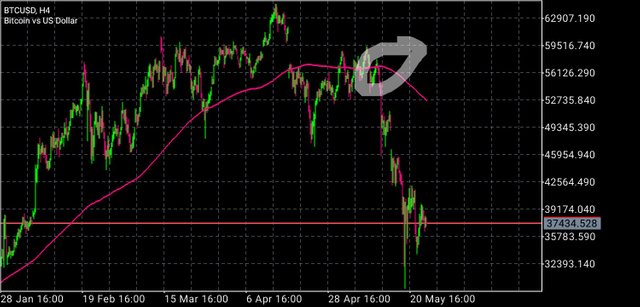
At a 4hour view of the trend shown at fig 1:4 we can now draw our conclusion. The pair BTCUSD has been in an uptrend pointing to possible
Change in the trend. At a 4 hour view we are certain of what trend that we are working on. The pair has been in an uptrend but now we have a strong indication that a downtrend is happening.
We shall now demonstrate a trade using an hour time frame. Our goal is to find our entry and exit points.
- NOTE: THIS IS MY TRADING METHOD, IT IS NOT A GENERAL GUIDE ON TRADING SWING STYLE
To do this I will add two period moving averages. The period of 10 and the period of 50. Some may use exponential moving averages here EMA, but I am using simple moving averages.
Fig 2.1
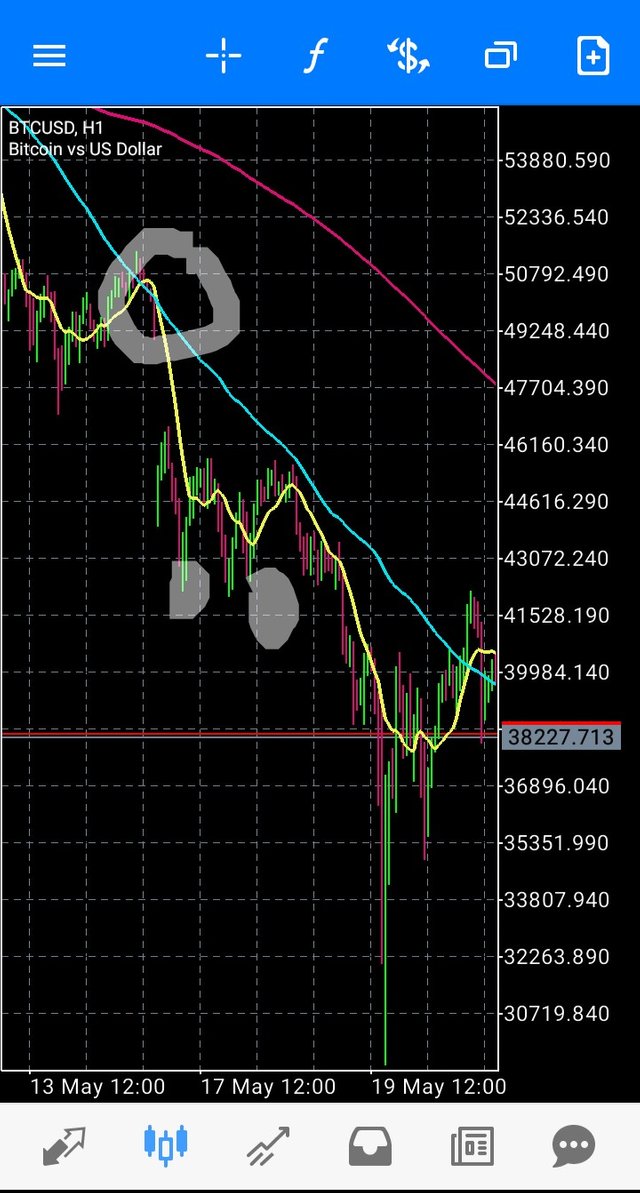
What I do here is simple, whenever the yellow 10 SMA crosses the blue 50 SMA from above, I have a sell signal, and when the yellow 10 SMA crosses the blue 50 sSMA from below, I have a buy signal. You must notice that the buy signal in fig 2.1 is not strong, the reason is because we are on a downtrend, so the sell signal is stronger. Therefore following the trend I will trade the sell signal, setting my stop loss close to available support.
There is another method to this strategy. In fig 2.1 I have already identified my support in the two circled points below. You may have noticed that whenever price reaches the blue 50 SMA line, it bounces back forming a resistance. Therefore I will trade the buy signal at support setting my stop loss close to the resistance - the 50 SMA. By so doing I can profit from the high down swing, I can as well profit from the high up swing.
- If you are using my method it is very vital to set up trailing stop loss.
HOW TO SET UP STOP LOSS AND TRAILING STOP
Fig 2.2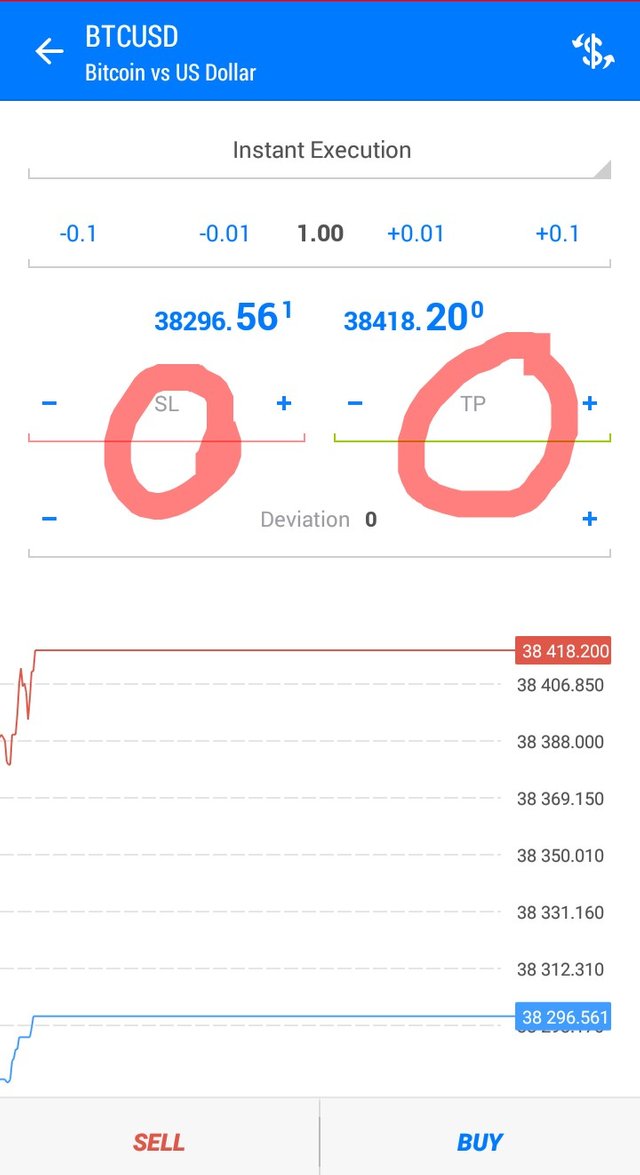
We set up stop loss a little below strike price and we take profit at our target price. Suppose our volume as shown fig 2.2 is 5 usd, we can set our stop loss at 4.6. Our take profit should be close to our target price. Using the sample in fig 2.1, we see resistance happening repeatedly at SMA period 50 ( the blue line). Using that as our target, we can set the take profit close to the resistance.
We set trailing stop loss when we have executed a trade. Once a trade move a little according to our prediction we can set a trailing stop loss.
We may not be able to fully demonstrate setting a trailing stop loss using the android template. Meanwhile you can read about how to do it in the link below:
Reference
CONCLUSION
Swing trading do not have one particular method. Yet the purpose is the same. Another good method is the use of candlestick to confirm signal. Read up here:
Reference
Please professor @yohan2on, rate my post
Hi @mobibliss
Thanks for participating in the Steemit Crypto Academy
Feedback
Good work though your work lacked an in-depth technical analysis of the swing trading Swing trading style.
Homework task
6