REPOST: Steemit Crypto Academy Season 5 Week 1 [Beginner's Course] - Understanding Trends: @misterfab
My Introduction
Its my pleasure to learn from this platform. This is my first time of engaging in a non fixed assignment and I hope to do my best with the below solutions to the given tasks. I really appreciate the efforts of our able professor @reminiscence01 in enlightening me about Trends. Here is my assignment presentation.
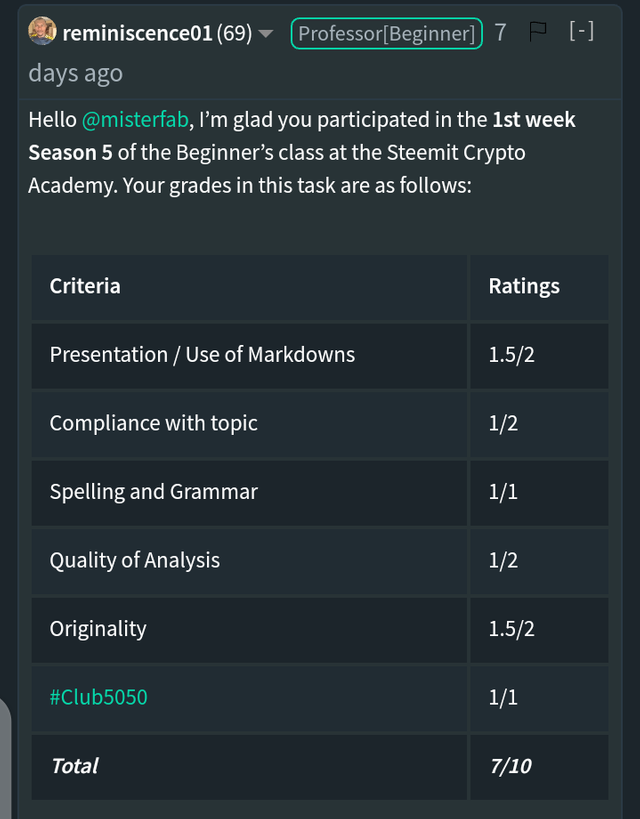 This is the rating of this post by @reminiscence01
Here is the link to this assignment post which has not been curated
1) a) What do you understand by a Trending market?
Whenever I hear the word trend, I only connect it to music, fashion, movies, sports and Languages. Little did I know that the crypto market possess Trending attributes . But recently, I've been familiar with the connection.
In every market scheme, there is always a tilt in price which is always affected by the engagements, interactions and struggles between traders of that market, demand and supply of that market.
This phenomenon is similar to the crypto market too. A Trending market is a phase of market or a market condition where the the price of a market goes in a specific direction for few continuous layers due to the impact of traders in terms of struggle, supply and demand.
Trending of a market basically involves two aspects of trend:
Uptrend and Downtrend.
Uptrend is the movement of the price upwards, but in this case, when a Trending market is moving up, the subsequent movement upwards arises above the previous high movement it made and even though it falls a bit, the price doesn't go lower than the previous low movement. That is why it's called an 'up' trend.
Downtrend operates on the opposite of the uptrend occurrence. The market forms a structure in which the price goes lower than the previous low point it attained. And this happens for few successive layers too.
Apart from these two forms of trends in market, we also have another phase of market which is the Ranging phase. In this phase, the market price is neither in an uptrend nor a downtrend, instead, it hovers between two specific points known as the support and the resistance points. We can also call this phase a sideways trend.
With the knowledge of trends, crypto prices can be predictable. This has been the case of Ethereum in the past two years.
It is important for traders to identify trends in market in order to know when to take advantage of the market. But one cause for optimism is the fact that it is important to know whether a trend is becoming weak and will reverse or whether it will continue. This is where the most important application of the knowledge of trends comes in. There are ways to identify the Trending phase of a market. They are inform of structures. Namely : Market Structure(formed by patterns on a market chart), Bullish Trend and Bearish Trends. I will use the answer to question 1.a to describe the bullish and bearish trend.
1) b) What is a bullish and a bearish trend? (screenshot required)
Bullish Trend
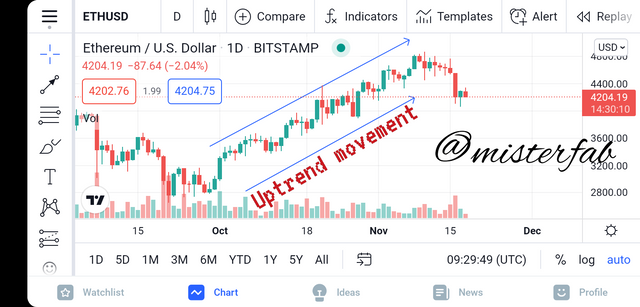
From my understanding and observations, A bullish trend market structure is used to detect an uptrend, that is, when the price of a crypto keeps going high, higher than the last high point. This does not mean that the movement is straightforward. Certainly, it experiences reduction in price at some intervals. But when it goes low, the price doesn't go lower than the last low point. It continues with this phenomenon for few successive turns. For a trend to be bullish(an uptrend), it means that many more traders are trooping in to buy the market, adding hugely to the the number of the acquisition of the market. This pushes the price up. In order words, the higher the demand, the higher the price.
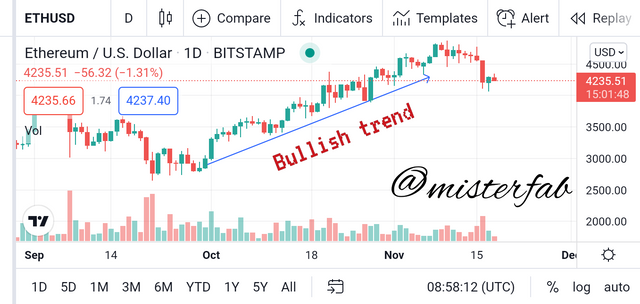 source A bullish Trend
In The above ETHUSD bullish trend(uptrend), the point of a slight pull down in price or retraction, indicated by the red candles in the above screenshot, may appear to a novice as a reverse in the trend of ethereum. This shows that the knowledge of the bullish way about is important for traders to actualize that a slight fall in the price will virtually make way for the price to go higher in the near future in the quest to exceed the previous high. Thus the trader will know when to invest(possibly during retraction) and earn.
Bullish trend indicates the 'general' rise in the market price. A confirmed Bullish trend is manipulated by the confidence of traders in the said market, the rate of convergence of new traders(increased demand), and positive interactions about the market within traders.
Bearish Trend
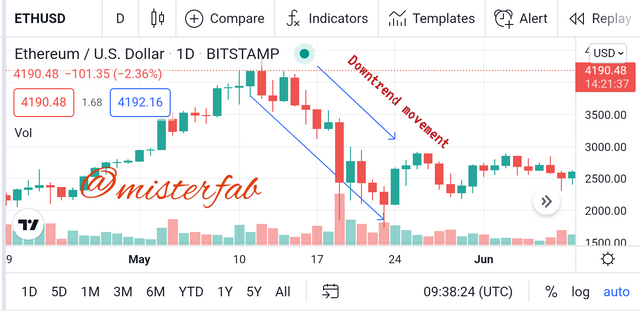
The bearish trend structure simply detects a downtrend. Seriously, no crypto trader wants to see this happening, because it can cause a serious loss to traders who intended to withdraw or go out of position for some reasons. As the name implies, it is a down time of the crypto market involved.
In this market structure, the market price forms continuous descending patterns on the chart.
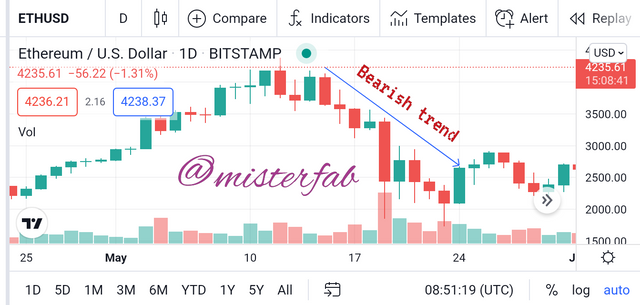 source A bearish Trend
In other words, in the highlighted part of the ETHUSD chart above, the price movement goes lower than the previous low and lower than the previous high, thus forming a bearish trend.
Nevertheless, since history repeats itself in trends, a serious downtrend may be a sign of an uptrend in the near future.

2) Explain the following trend identification and give an example of each of them. (Original screenshot needed from your chart). Do this for a bullish and a bearish trend: i. Market Structure, ii. Trendlines
Market Structure
The market structure is the most common eye catcher on a market graph or market chart. Generally, we use a graph chart to study a market structure.
The patterns formed by either candlestick or other mediums on a market structure enables a trader to know whether a market is in ranging sideways, in an uptrend or a downtrend direction.
In general, the market structure shows a pattern we can use to detect a trend within a period of time indicated below the graph.
Let me assume that I activated candlestick display on my market structure chart. If the price movement patterns traced by the candlestick shows a higher-high and a higher-low formations from the price, the market structure exhibits an uptrend and can be indicated with a bullish line.
 source An Uptrend market direction
On the other hand, if the patterns traces a lower-high and a lower-low formation, it is dictated as a downtrend, and indicated with a bearish line.
 source A Downtrend market direction
A ranging market structure is antagonistic to bullish and bearish market structure because it is neither uptrend or downtrend.
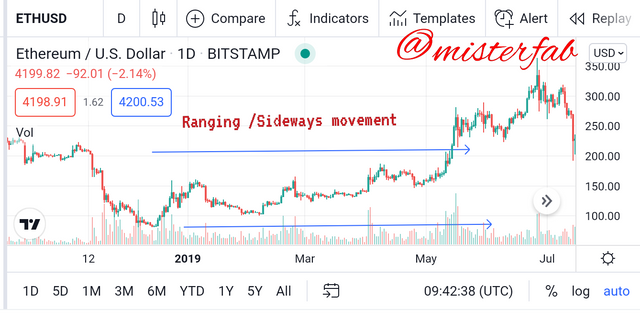 sourceA Ranging market direction
It goes in between two figurative horizontal lines and repeats equal highs and lows at pairs and series of different movement intervals.
Trendlines
A trend line is a straight diagonal line used to connect few different chosen price points to know the price movement within a specified period of time, and detect the market data and trend being experienced.
When a trendline is drawn, and the price keeps hovering forward above the trendline, creating higher points than the previous high points and higher points than the retracement points, when it is obvious that the price pattern on the chart doesn't go across the diagonal trendline drawn, then an uptrend is confirmed. In this case, sometimes most of the retracement points of the price movement might hit the trendline and bounce back upwards without crossing it.
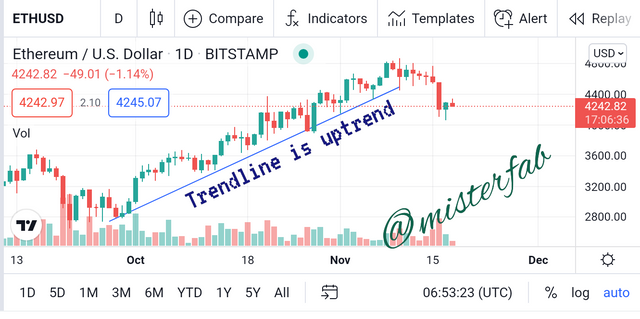 sourceAn Upwards(Bullish) Trendline
To check if a bearish trendline is in place, the pattern trace of the price keeps roving downwards, forward below the line, forming lower lows and lower highs, roughly like a descending staircase.
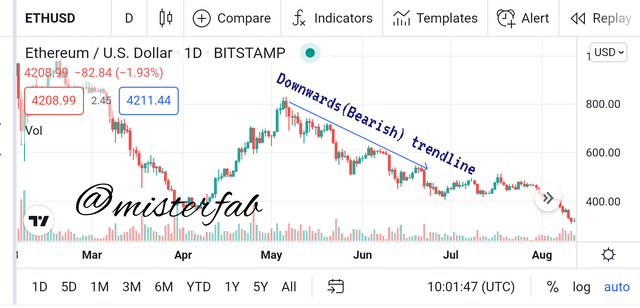 sourceA downwards(Bearish) trendline
Note : In both bullish and bearish trendlines, the prices do not interfere with or cross over the trendlines, if not so, the trend may not be validated, or it might be a serious sing of reverse in trend. A trend line can easily be drafted by linking two or more low price points in an uptrend, and two or more high price points in a downtrend.
3) Explain trend continuation and how to spot them using market structure and trendlines. (Screenshot needed). Do this for both bullish and bearish trends
Trend Continuation
Continuity is a factor that fosters optimism in the knowledge of trends. When a market is Trending we normally want to figure out whether the trend will continue or whether it will reverse. This curiosity can be quenched with the study of the significant structure details left by the movement of the market price. These details are seen when trends continue itself in a successive movement. We always look out to know whether the tend is reversing or continuing because up and low repetitive movements take place.
Therefore, trend continuation can simply be put as signs or movement signals used to know whether a trend will stay on its course and repeat its directions.
We can study the most tiny details on the trend slope of the market chart pattern to detect trend continuation.
Why it is important to determine trend continuation:
The price structure of a cryptocurrency market doesn't move in a straight line. It even changes within minutes, Seconds and hours. The price reduces sometimes in order to rejuvenate its momentum and take off for a higher price. This examination is applied to an uptrend and a downtrend.
In a uptrend, The retracement point always touches the bullish trend line in a market chart. Retracement occurs at a high price rate when traders retrieve their profits from the market. The price falls back to its normal and restrategizes to take off for a higher price(in uptrend).
To lay more emphasis, after a significant upwards rise, in order to acquire resistance and maintain that upwards momentum, the price falls back to rest a bit then traders take their trading positions by collecting their gains and making new entries.
Traders who understand this phenomenon well can know whether a trend will continue or if it may be reversed.
To confirm a Bullish trend continuation, the current high point must be higher than previous high point and the current low point should also be higher than previous low point.
To confirm a Bearish trend continuation, a new lowered point should be attained in every proceedings, that is, lower than the previous low and lower than the previous high.
In a more sensitive further examination, For a market structure, when the price successfully overcomes resistance and gives in to support in several successful layers, (in a bullish way) the streak will tend to be Interrupted with turn around in movement. This means that resistance can go lower than the previous resistance price point, violating the structure pattern. This is a very significant sign of reverse in trend. At this stage, resistance can then happen twice and the trend ends/changes its pattern of movement to downward.
During the bearish way too when there have been successful layers of lower lows and lower high points, the structure pattern tends to start making unusual movements upwards, crossing the height of the previous highs and failing to touch the previous low points. If this happens once, it could be a sign of reverse in trend, and if it repeats, there should certainly be a change in trend direction.
Using Trend Lines to spot trend continuity is a bit easier. As long as the line is not broken. If the trendline is interrupted or crossed by the price pattern, it is a very important sign of possible trend reversal. And if it happens on a streak, the trend is virtually reversed.
The below screenshots will explain a sign of a possible trend reversal /discontinuation spotted with the aid of a bullish line breaching and a bearish line breaching
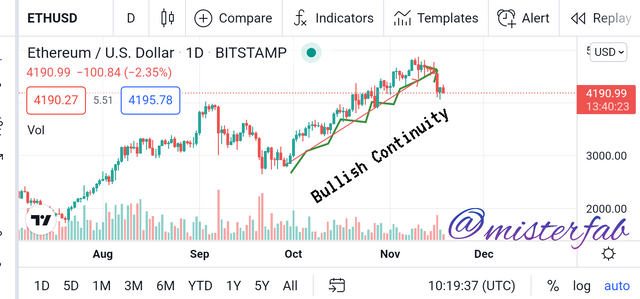 sourceA Bullish Trend continuation
The above shows a bullish Continuity in the ETHUSD price from October to Early November in the chart.
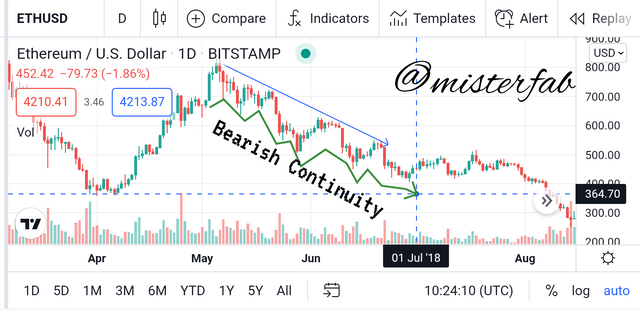 sourceA Bearish trend continuation
The above shows a bearish Continuity in the ETHUSD price from May to July in the chart.
4) Pick up any crypto-asset chart and answer the following questions
i) Is the market trending?
I have been using the ETHUSD chart throughout this assignment task, and most times I found it a bit difficult to spot a bear movement in the market.
Yes. It is Trending.
Since 2020, the price of Ethereum has rapidly indulged in a bullish movement, even though it has ranged for a good number of times. It was in a very low and ranging phase for a very long time until the end of 2020 as in the screenshot below.
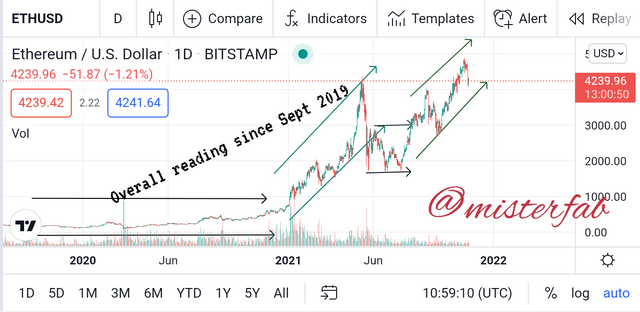 sourceA Major Trend in ETHUSD since 2019
This is significant in the fact that Ethereum, as at when I am making this post is ranking 2nd among other cryptocurrencies.
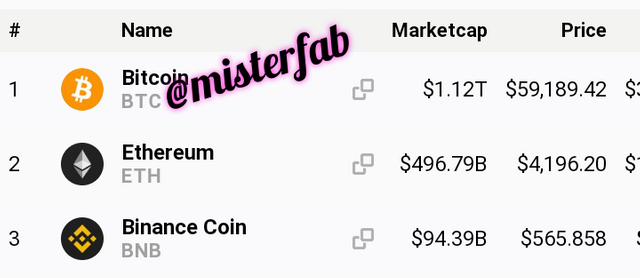 Source
Unlike three to five years ago when it wasn't even among the first 20. We can as well, see the market cap, the price, and the daily supply.
ii) What is the current market trend? (Use the chart to back up your answers)
This high rate of demand shows an overall uptrend(bullish movement) in the recent years as seen on the ETHUSD chart..
Currently, the Price is violating the bull and it is apparent that a bear or a range will take place from now onwards as seen in the screenshot below
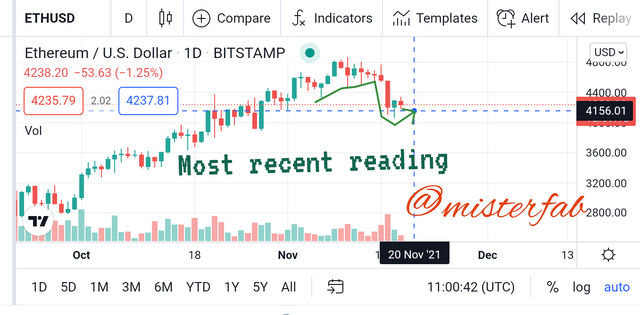 sourceA current violation/trend reversal in ETHUSD
Now, since the lower-low formation is apparently violating the preceding bull, A trader can easily detect bearish movement or ranging phase in the ETHUSD market.

Conclusion
Crypto market technical analysis is interesting when we are familiar with the indicators, the structure and the phase of the market. Learning how to use indicators to study trends is very important. It is advisable to learn them as early as possible instead of assuming that they are hard, just like I did some months ago.
Another notable thing is that it is better to use the best indicator or method that suits a market to dictate the market structure, instead of using only the ones we are familiar with. The ones we are familiar with, may not fully suit the market structure we want to study. So it's good to be familiar with most of the indicators, the trends and the phase. Some other important terms I have come across and understood in this session are: Resistance, Support, Trend Continuation, The bear and the bull. I am overwhelmed.
All the screenshots and pictures in this post were source-cited and edited by @misterfab for the purpose of this assignment. The rest are decorated banners or dividers widely used by steemians.
My deep gratitude goes to the @steemitblog group and to our able professor @reminiscence01 for this opportunity and help.
I have answered all the questions in this task and I hope it'll be read by the right people.