Understanding Trends II - Crypto Academy / S5W3- Homework Post for @reminiscence01
Today I am going to do the homework of another important class. Understanding trend has been discussed through this lesson and I am going to do today's homework from that knowledge. So let's get started.

Explain your Understanding of Trend Reversal.
We have learned many important things about Trend in the previous discussion. I got different ideas about uptrend and downtrend there. I just want to say something about the uptrend and the downtrend so that I can discuss the trend reversal. An uptrend is when the price of a product gradually increases in the market in a given timeframe. Downtrend is the opposite of uptrend. When the price of a product in the market starts to reduce in a certain timeframe it is called downtrend.If there is no uptrend and downtrend this situation called sideaway.
Now the most important thing is that when there is uptrend movement it will continue, It's wrong. Again when downtrend starts, it can finish anytime and the market can change the direction of the market. It is very important to know as a trader when can break the trend. Other wise the trader can lose his profit. So from the discussion we can say that market changes the direction of price. The change of direction of price is called trend reversal. Generally, we saw in uptrend reversal after the downtrend on the other hand downtrend reversal occurs after uptrend.
What is the benefit of identifying reversal patterns in the Marke
- It is very important to know when an uptrend reversal can happen. Otherwise, a trader would face a big loss there. When a trader realizes the uptrend reverse, he must change his trading strategy.I think Identifying Uptrend reversal one kind of profit.
- Similar incident can happen with a trader when he can not identify in downtrend reversal. From the identifying trend reversal a trader is able to determine where to entry and where to exit in market which you have to know as a trader.
- Identifying trend reversal can secure your profit. It’s will help to determine entry and exit position and trader will be profitable.
b) How can a fake reversal signal be avoided in the market? (Screenshot needed).
It is just as important to know the trend reversal as it is to know the fake trend reversal. If a trader can not understand fake trend reversal, he can make a big loss. First of all we can avoid fake trend reversal by using technical indicators.
Let's look a chat.
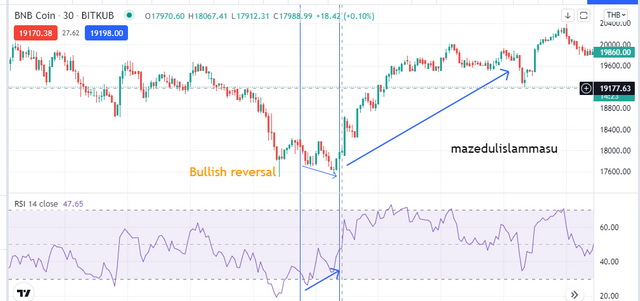
If we look here carefully candle trying to create bearish market but real situation will happen bullish. As a result, we should use indicators with chart for avoid fake reversal.
In the screenshot I have tried to show you avoid fake reversal. By the trend line we also can guess that it is fake or real reversal. Let's look carefully where breakout happened we ill try to wait for next green candle. If it's green we can confirm that real breakout happening .
- Give a detailed explanation on the following Trend reversal identification and back up your explanation using the original chart. Do this for both bullish and bearish trends (Screenshots required).
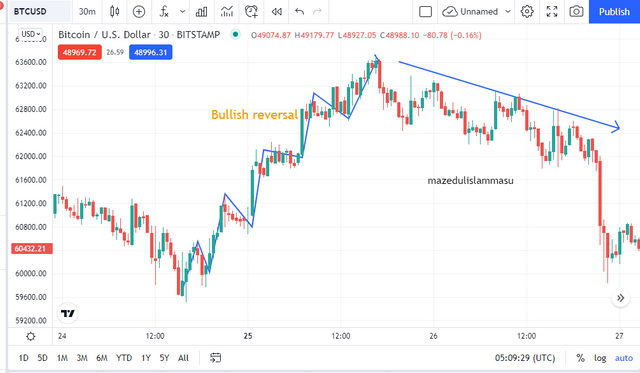
In any market in the world, the combination of buyers and sellers helps to create a market structure. When the market behaves like high, higher high and low, higher low it's a bullish momentum. When the combination break or its failure to create a high and higher high in the bullish trend it is known as a break of bullish market structure. A screenshot of the break of the bullish market structure is given below.
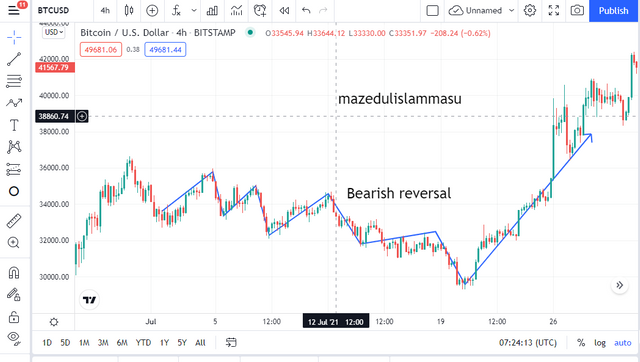
In the bearish market, the structure creates when the market fails to create lower low and lower high candlestick patterns. Actually, it happens due to the dominance of sellers in the market. For better understanding, a screenshot is given below.
Break of Bullish market structure
Break of Bearish market structure
b) Break of Trendline.
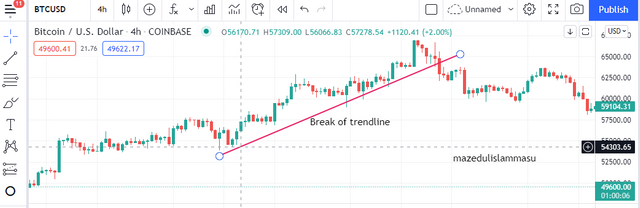
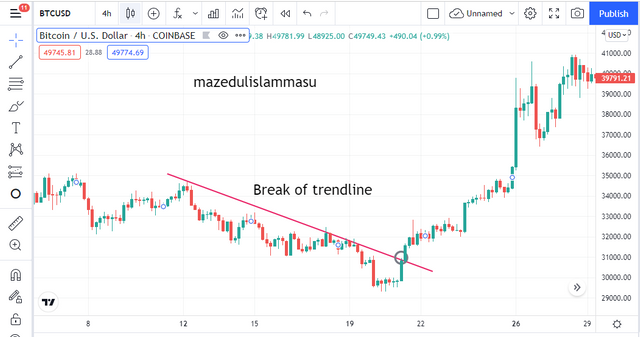
We have learned about two trendlines in the previous class which are the bullish trendline and bearish trendline. A trendline is an important tool that is used to understand the movement of the market. Because it's to understand where the price bounces back. We can understand where is the support and where is the resistance. I usually add the bullish trend line to the top of the candlestick pattern. On the other hand, we add a bearish trendline understand the candlestick pattern. To better understand I want to show a screenshot.
Break of bullish trendline
Break of bearish trendline
c) Divergence
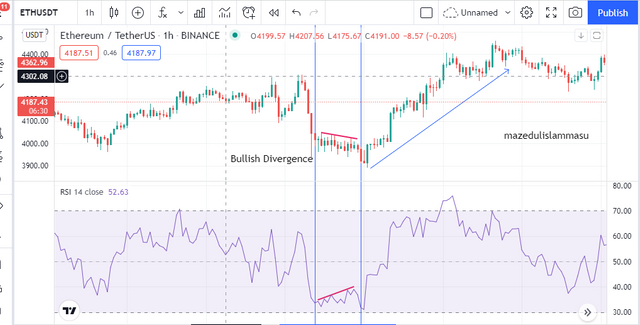
We all know that the use of technical indicators is very important. I usually use technical indicators to understand the price movement. So there is a relationship between price movement and technical indicators. Divergence is a situation where there is a disagreement between the technical indicator and the price movement. For example, the bullish moment of a product is going on. In the time price will make a higher high as usual but at the same time, technical indicators will show us a lower low.
Bullish Divergence
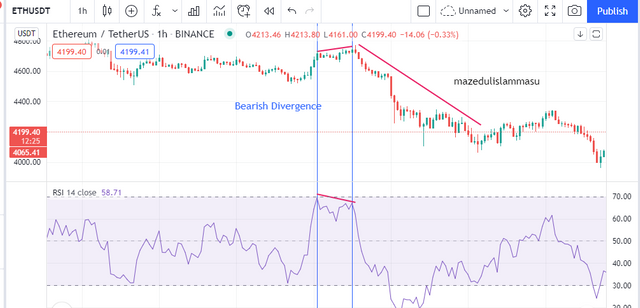
Bearish Divergence
d) Double top and Double bottom
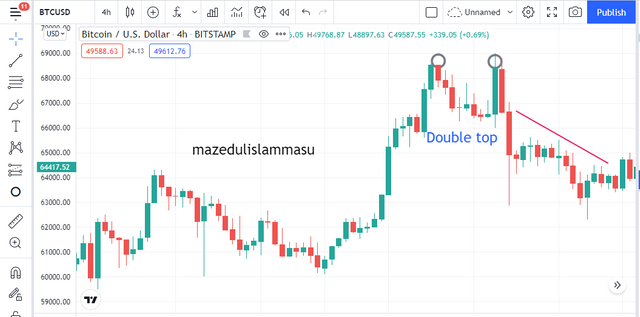
Traders need to know double top and double bottom to figure out what the next price movement situation might be. Double top and Double bottom identification is another example of a trend reversal. When there is a double top created and when there is a bullish moment in the market, we usually assume that it may go to the market bearish moment. By a proper screenshot is given below for better understanding.
Double Top
Double bottom
.png)
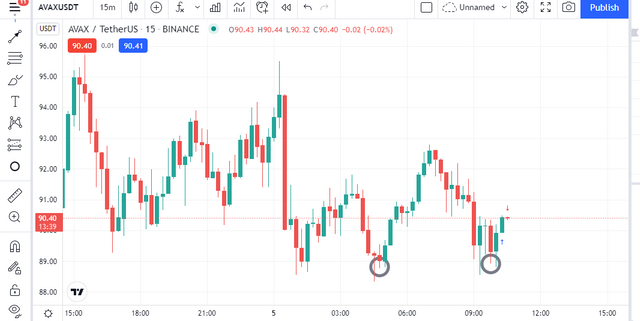
- place a demo trade using any crypto trading platform and enter a buy or sell position using any of the above-mentioned trend reversal/continuation patterns.
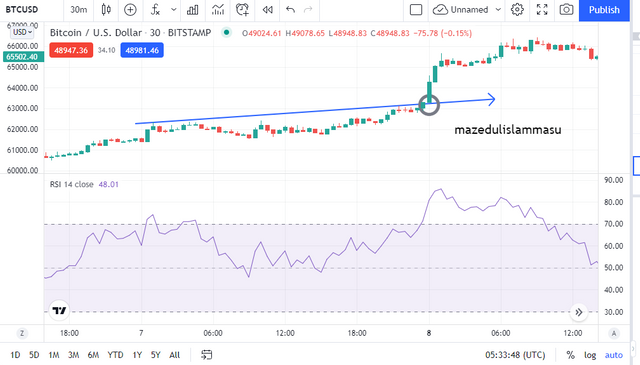
To answer the question, I go to the tadingview website so that I can find any of those reversal. Finally, I have got a pair where double bottom candlestick pattern was created. As I learnt after double bottom bullish moment may happen. That is why I have created a long position.
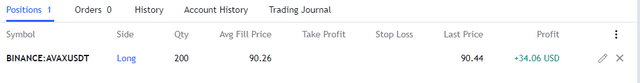
Let's look the result of my long position. Yes it is giving me profit and the knowledge of double bottom working.
In the second part of trend Understanding, I learned many important things. A different topic such as trend reversal, break of market structure, break of trendline, divergence as well as double top and double bottom explain very beautifully my honorable professor @reminiscence01. I want to thank for his beautiful and educative lesson.
Hello @mazedulislammasu , I’m glad you participated in the 3rd week Season 5 of the Beginner’s class at the Steemit Crypto Academy. Your grades in this task are as follows:
Recommendation / Feedback:
Thank you for participating in this homework task.