Trading Using Rectangular Pattern - Steemit Crypto Academy - S5W4 - Homework Post for @sachin08
Hello guys. Hope everything is going well. The topic I am going to do my homework on today is rectangle pattern. So lets get started.

1. Explain Rectangle Pattern in your own word.
Traders usually do technical analysis to understand the next moment of the market. There are different types of structures in the market which are part of a technical analysis. The most important thing is that another goal of technical analysis is to identify support resistance and find out when the market will breakout.
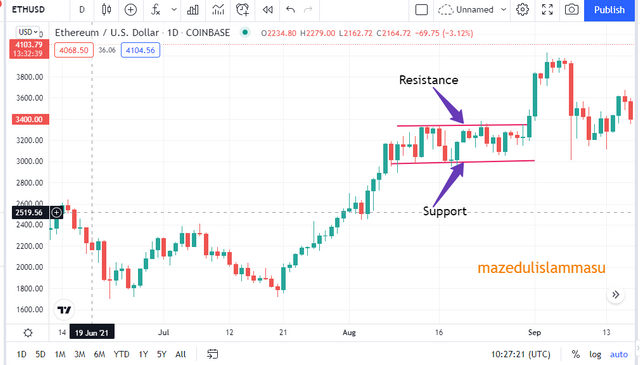
If there is no huge bullish or bearish moment in the market. In that case the candlestick patterns tend to fluctuate at short distances. If we drow two horizontal trendlines in this range and one trendline acts as support and another one as resistance. The pattern we see from there is Rectangle pattern. The condition to fill the rectangle pattern is that the candlestick patterns must be between the two horizontal trend lines.
Now the question may be if such a pattern is formed then what can we perceive from the market. Yes, of course if it form such a pattern we will see a movement after the market, it could be bullish and bearish. I have given you a screenshot to make the matter clearer.
2. How to identify Rectangles. Explain with Screenshots.
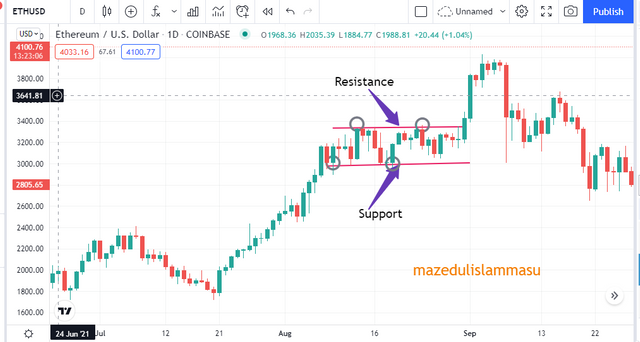
Identify rectangle is the important part of the lesson. We have already known from the lesson that rectangle pattern is very rare to create. We also learned that there are basic thing which to find out the Rectangle pattern. Let's see the rectangle pattern discussion with screenshot.
3. Can we use indicators with this pattern to get accurate results? Explain with Screenshots.
If the rectangle pattern is formed then there is a noticeable change in the next market, it may be bullish or bearish. We can tell by the candlestick pattern when the market breaks out.
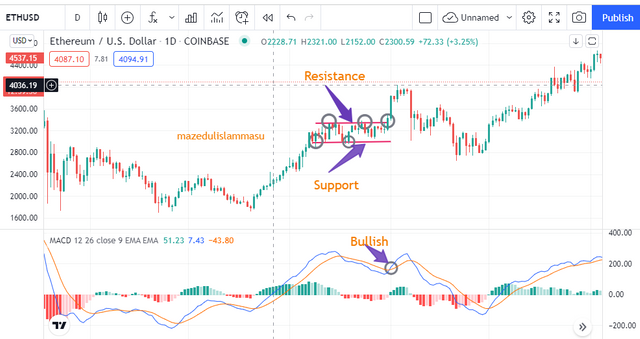
In the question, I will say yes. We can use technical indicators with this pattern to get a accurate results. When the market breaks out we can understand it very well with the help of technical indicators. Let's see a screenshot for better understand.
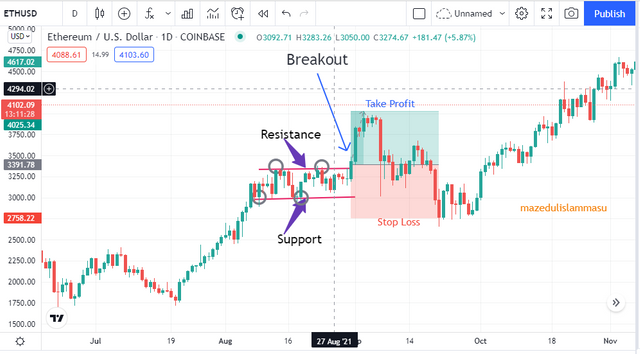
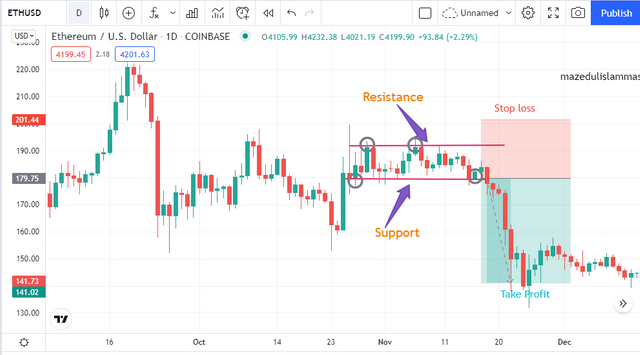
4. Explain Rectangle Tops and Rectangle Bottoms in your own words with Screenshots of both patterns.
5. Show full trade setup using this pattern for both trends. ( Entry Point, Take Profit, Stop Loss, Breakout)
Conclusion
Today, through Relation, the professor has taught us about Rectangle pattern. We have learned how to identify rectangles pattern from candlestick pattern. This lesson shows us that when the market has such a structure then we can get bullish or bearish movement. I think the success of technical analysis is here when we can guess the next movement.
From here we have learned about where to use stop loss, where to take entry and where to exit, where to use take profit. The most important thing we know about rectangles pattern is rectangle top and rectangle bottom. Rectangles Top and Bottom will be in which state and if certain conditions are met it will be Rectangles pattern, which is beautifully presented to us through this lesson. I read this lesson with ease and learned some very important things. Many thanks to the professor @sachin08 for giving us this important lesson.