Crypto Trading With Williams % R Indicator - Crypto Academy / S4W4 - Homework Post for [@kouba01]
Hello! Steemians, I am @masumrbd. In Steemit Crypto Academy Season-4, Week-4 is running. Now, I am writing my homework task about "Crypto Trading With Williams % R Indicator" for professor @kouba01. Let's get started:

1- Explain the Williams %R indicator by introducing how it is calculated, how it works? And what is the best setting? With justification for your choice.
The Williams %R indicator
The Williams %R is also known as Williams Percent Range, is a technical indicator. The spread of this indicator is between two levels, 0 and -100, where 0 indicates overbought, and -100 indicates the oversold levels. The indicator is a momentum type of indicator that was invented in 1973 by Larry Williams.
The Williams %R indicator measures the strength of a current trend in the market. The momentum situation in the market can easily identify by the Williams %R indicator. If the line of the indicator in between 0% to -20% is considered as an overbought condition, but if the line of the indicator in between -80% to -100% is considered as an oversold condition in the market.
Calculation of Williams %R
The mathematical formula for Williams %R is as follows:
Willams %R = (Highest High - Close)/(Highest High - Lowest Low) * -100
Where,
Highest High = Highest price within "n" periods of time.
Close = Price close for the day.
Lowest Low = Lowest price within "n" periods of time.
Now let's do a calculation; for this, I have used BNB / USDT chart. I have set 1 day as time and calculated periods as 14.
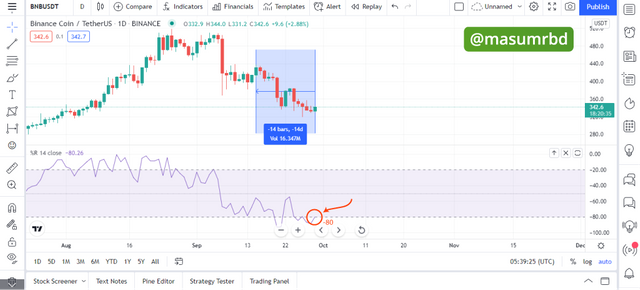
The data from the last 14 candles from the chart above are-
Highest High = 438
Close = 342.8
Lowest Low = 320
We know,
Williams %R = (438 - 342.8) / (438 - 320) × -100
⇒ Williams %R = (95.2 / 118) × -100
⇒ Williams %R = 0.80 × -100
∴ Williams %R = -80%
Here we have found Williams% R = -80%, and if we look at the screenshot above, we can see that the Williams% R in the screenshot also showed a -80% result. So we can say that the market is in oversold condition right now.
Williams %R Indicator Best Setting
The default setting of the Willams% R indicator is 14 periods; developer Larry Williams of the indicator recommends it.. Most traders use 14 periods. But in my opinion, the best setting will depend on one's trading strategy. If someone trades for the short term, then short periods will be used. But if someone trades for the long term, he must use longer periods to get the signal out.
We will never be entirely dependent on an indicator, even if we use the best settings. It is best to use another technical indicator with it; an EMA indicator or another indicator can be used. When two indicators give the same signal, we will be able to trade, and our chances of making a profit will increase manifold.
2- How do you interpret overbought and oversold signals with The Williams %R when trading cryptocurrencies? (screenshot required)
Overbought Signals
The Willams% R indicator indicates an overbought signal when the value of the indicator is between 0 and -20. This is a lot like the RSI indicator. The 0 to -20 value indicates buying pressure in the market, meaning that buyers control the market. Trend reversal can happen from such area. Again many times, the market may show up more bullish condition from here.
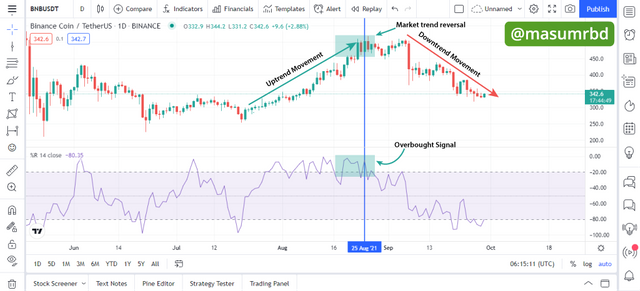
In the above screenshot, BNB/USDT pair, we can see there was market uptrend movement, and the value of the Willams% R indicator is between 0 to -20, so it indicates an overbought condition. In other words, there is a possibility of trend reversal, and we saw that the bearish movement started in the market.
After an overbought condition, reversal may not happen all the time. Many times the market is seen to be more up even after overbought condition. So, we must use another indicator for the confirmation.
Oversold Signals
The Willams% R indicator indicates an oversold signal when the indicator's value is between -80 and -100. The -80 to -100 value suggests that there is selling pressure in the market, meaning that sellers control the market. Trend reversal can happen from such area. Again many times, the market may show up more bearish condition from here.
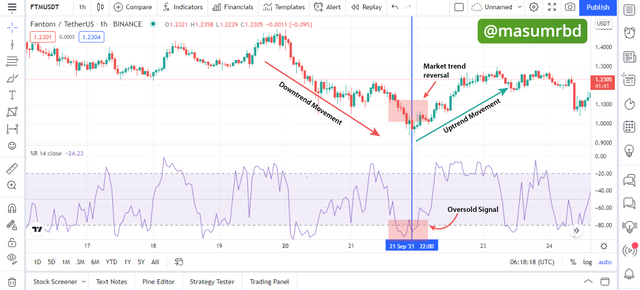
In the above screenshot, FTM/USDT pair, we can see, there was market downtrend movement, and the value of the Willams% R indicator is between -80 to -100, indicating an oversold condition. In other words, there is a possibility of trend reversal, and we may see that the bullish movement started in the market.
After an oversold condition, reversal may not happen all the time. Many times the market is seen to be more down even after oversold condition. So, we must use another indicator for the confirmation.
3- What are "failure swings" and how do you define it using The Williams %R? (screenshot required)
The Failure Swings
The Failure Swings happens when the value of Williams% R indicator is failed to reach its two levels overbought (0 to -20) and oversold (-80 to -100) condition. When this happens, then it is assumed the strength of the trend is weak. At this time, Willams% R indicator no state can reach this. So it becomes challenging to make decisions about trading here. But at such times, the trend is often reversal.
When the Williams% R indicator value tries to reach the overbought condition at -20, then a failure swing will result in a quick trend reversal, bullish to bearish and unable to get the overbought danger value limit -20. But when the Williams% R indicator value tries to get the oversold condition at -80, then a failure swing will result in a quick trend reversal, in this case, bearish to bullish and unable to get the oversold danger value limit of -80.
Bullish Failure Swing
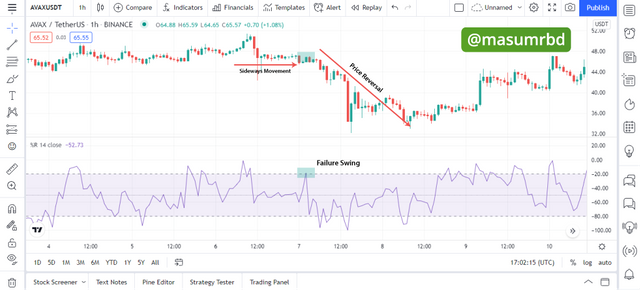
In the screenshot above, AVAX/USDT pair, a bullish failure swing is formed where the Williams %R indicator value tries to approach -20 and failed before the bearish trend reversal occurred. This means that the bullish trend was weak, and the sellers are controlling the market and quickly changed the market condition from bullish to bearish.
Bearish Failure Swing
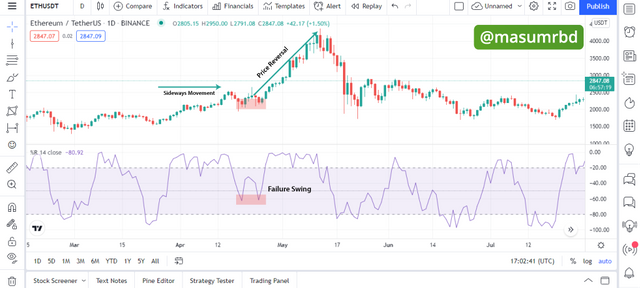
In the screenshot above, ETH/USDT pair, a bearish failure swing is formed where the Williams %R indicator value tries to approach -80 two times and failed at -62.41 before the bullish trend reversal occurred. This means that the bearish trend was weak, and the buyers are controlling the market and quickly changed the market condition from bearish to bullish.
4- How to use bearish and bullish divergence with the Williams %R indicator? What are its main conclusions? (screenshot required)
Divergence
Divergence occurs when the indicator and movement of price direction will be opposite to each other. There are two types of divergence bullish divergence and bearish divergence.
Bullish divergence in the Willams %R indicator
The bullish divergence occurs when the Willams %R indicator indicates a bullish signal and the current indicator high will be higher than the previous one, but the price movement in the market reacts bearish. In this case, Willams %R indicator shows bullish movement but the actual price movement is bearish in the market.
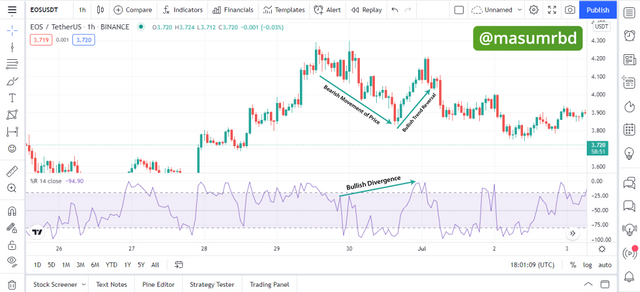
In the screenshot above EOS/USDT pair, we can see a bullish divergence was formed, where the Williams %R indicator forms a sequence of higher highs, while the movement of price formed a sequence of lower highs.
Bearish divergence in the Willams %R indicator
The bearish divergence occurs when the Willams %R indicator indicates a bearish signal and the current indicator high will be lower than the previous one, but the price movement in the market reacts bullish. In this case, Willams %R indicator shows bearish movement but the actual price movement is bullish in the market.
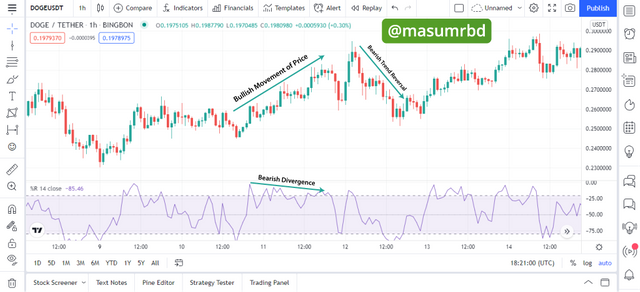
In the screenshot above DOGE/USDT pair, we can see a bearish divergence was formed, where the Williams %R indicator forms a sequence of lower highs, while the movement of price formed a sequence of higher highs.
5- How do you spot a trend using Williams %R? How are false signals filtered? (screenshot required)
Trends Spot by Using Williams %R Indicator
The Williams %R indicator is used to spot trends and trend reversal both. For bullish trendthe indicator line is above the -50 line and for the bearish trend the line will be below -50. It is not wise to use the Willams %R indicator to make signals. For getting the best signals for higher profit we should use the Willams %R indicator with another indicator for the confirmation of the signal. Let's see some examples-
Example - 1 (False Signals)
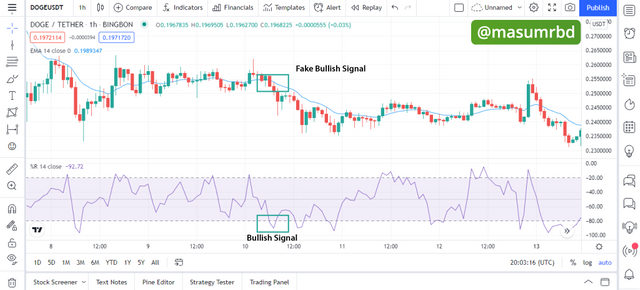
In the screenshot above DOGE/USDT pair, the Williams %R indicator shows an oversold condition the price moves bearish and the indicator value was below -80. Then the indicator moved above the -80 line means the market is controlled by the buyers. If we look at the EMA indicator (which is set to 14 periods of length) the market price was below the EMA line means there was bearish trend in the market. The bullish signal provided by the Willams %R indicator was a false signal that is confirmed by the EMA indicator.
Example - 2 (Good Signals)
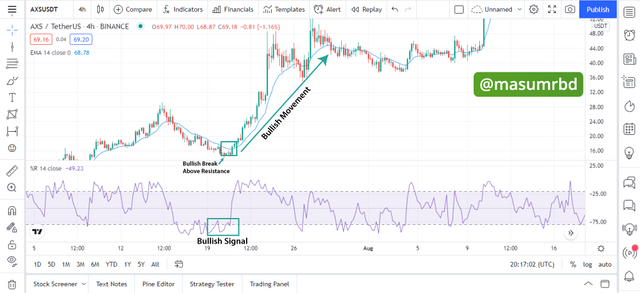
In the screenshot above AXS/USDT pair, the Williams %R indicator shows an oversold condition the price moves bearish and the indicator value was below -80. Then the indicator moved above the -80 line means the market is controlled by the buyers. If we look at the EMA indicator (which is set to 14 periods of length) the market price was above the EMA line means there was bullish trend in the market. The bullish signal provided by the Willams %R indicator was confirmed by the EMA indicator and it was a good signal.
6- Use the chart of any pair (eg STEEM/USDT) to present the various signals from the Williams %R indicator. (Screen capture required)
1- Buy Signal
A buy signal occurs when the Willams %R indicator line was in -80 to -100 indicates oversold condition. But there are a lots of false signals provides by the indicator thats why I prefer to combine with another indicator for the confirmation of the signal. I use EMA with the Willams %R indicator in both 14 periods of length to overcome any false signals.
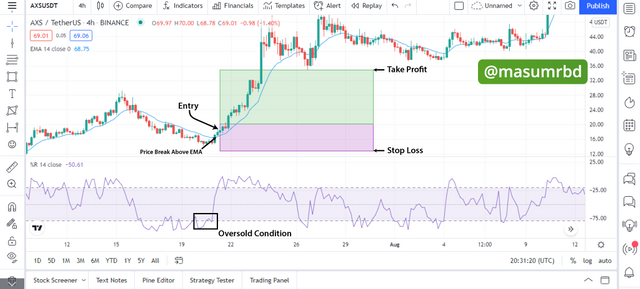
In the screenshot above AXS/USDT pair, the Willams %R indicator indicates oversold condition because the line was in between -80 to -100. This gives a bullish signal in the market. The buyers are controlling the market.
Now, I check the signal with combining the EMA indicator. We can see the EMA line break out and confimed the bullish signal. I put the stoploss slightly lower the EMA price breakout and set my risk : reward to 1:2 ratio.
2- Sell Signal
A sell signal occurs when the Willams %R indicator line was in 0 to -20 indicates overbought condition. But there are a lots of false signals provides by the indicator thats why I prefer to combine with another indicator for the confirmation of the signal. I use EMA with the Willams %R indicator in both 14 periods of length to overcome any false signals.
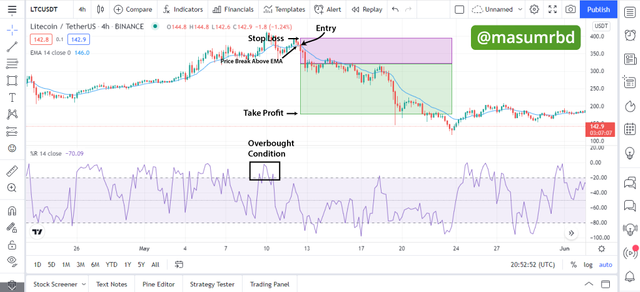
In the screenshot above LTC/USDT pair, the Willams %R indicator indicates overbought condition because the line was in between -0 to -20. This gives a bearish signal in the market. The sellers are controlling the market.
Now, I check the signal with combining the EMA indicator. We can see the EMA line break out and confimed the bearish signal. I put the stoploss slightly upper the EMA price breakout and set my risk : reward to 1:2 ratio.
Conclusion
The Willams %R indicator is a useful technical indicator. This indicator measures the strength of a current trend in the market. There are values of this indicator in between 0 and -100 where 0 indicates overbought and -100 indicates the oversold levels. Trader often use this indicator for identification of early trend reversals.
There are a lot of false signals generated by the Willams %R indicator thats why it is best to use with another technical indicator for confirmation. In the task above I use EMA and shows how to combine with the Willams %R indicator and filter out the false signals also get the good signals.
Best Regards,
@masumrbd
Hello @masumrbd,
Thank you for participating in the 4th Week Crypto Course in its 4th season and for your efforts to complete the suggested tasks, you deserve a Total|10/10 rating, according to the following scale:
My review :
Excellent content in which you were able to answer all the questions related to the WPR indicator with a clear methodology and depth of analysis which is a testament to the outstanding research work you have done.
Thanks again for your effort, and we look forward to reading your next work.
Sincerely,@kouba01
Thank you.